FALL 2018 DAYTIME CLASSES
SEPTEMBER - DECEMBER 2018
DATA WORLDS
Tuesdays, 9:30am - 3:00pm | Ages 8 - 14 | September - December 2018
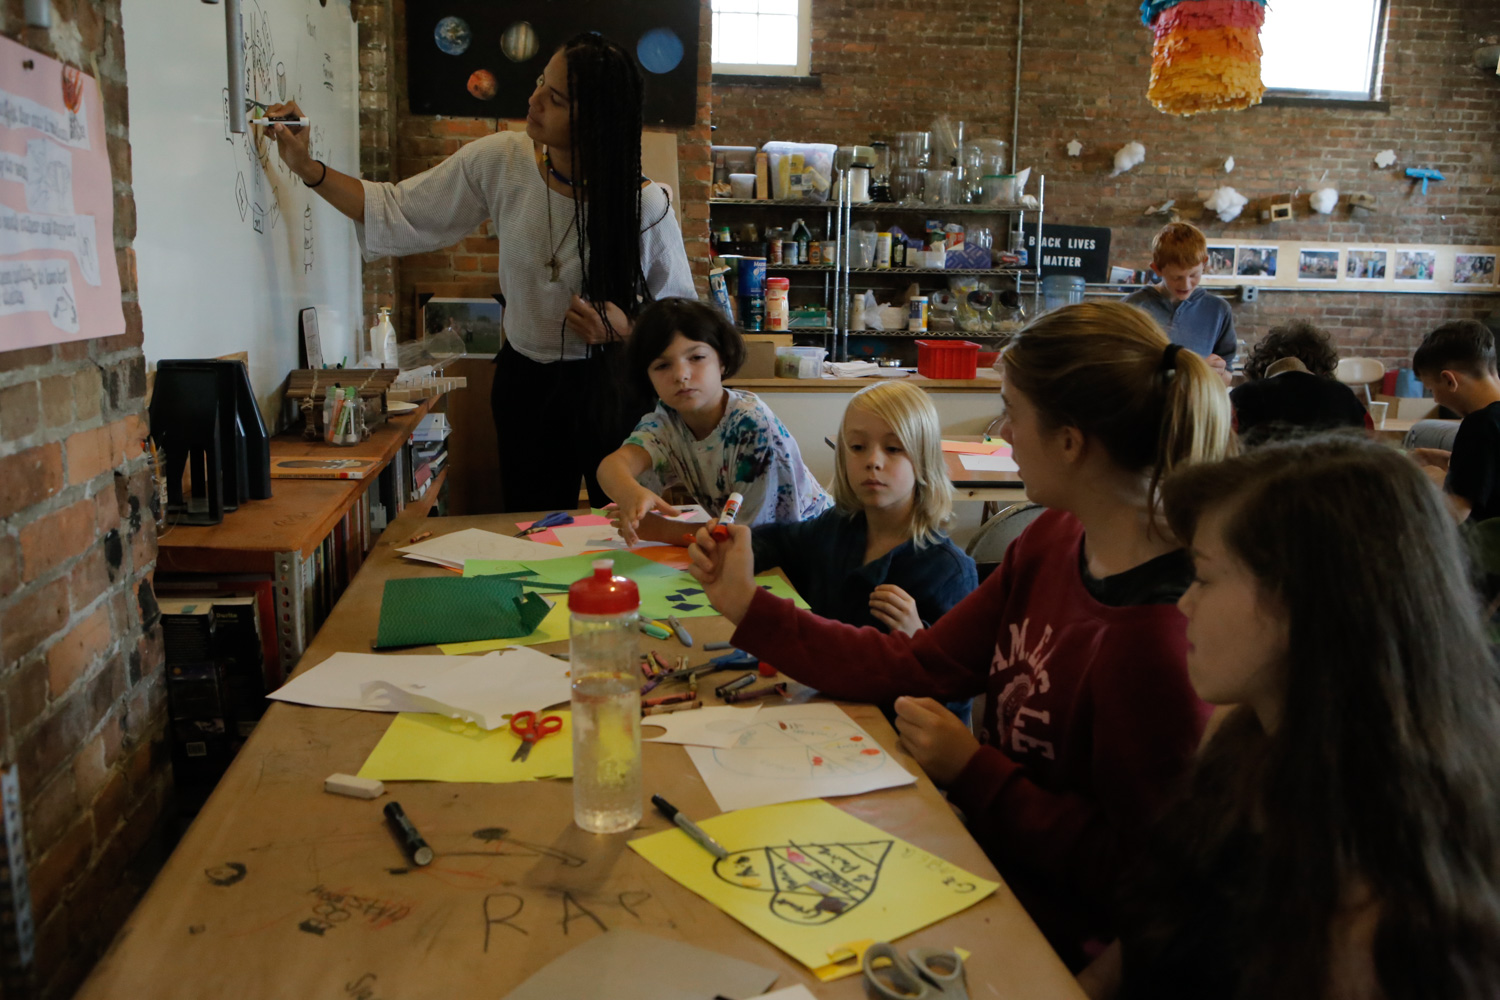
A math and art class for people who love to ask questions. With Zebi Williams and Alex Guerrero.
Data Worlds was a space to excite creativity around the collection, synthesis, and visualization of data. It was our goal to create an empowering environment for students with different levels of familiarity and fluency in math and mathematical concepts to engage comfortably with data art and analysis.
What is data, and how is it shaping our world?
We began by looking at historical and contemporary examples of data visualizations to ask some foundational questions: What is data? Why data? What purpose does the catalog and quantification of objects, actions, trends, and behaviors serve in our world? And -- how does it define our humanness? We examined ancient math ideas and ways of organizing data: learning about the ancient Mayan knot-tying recording dives, called Quipu; and creating Mesopotamian Clay Tokens, an early solution for exchanging quantities of goods without writing. We watched a PBS documentary called “The Human Face of Big Data,” to begin thinking about how data is changing our world. We explored the concept of Big Data, and the impact of data on our current and future world, asking questions like: What are the dangers of data? And what opportunities will data create?
Data Literacy
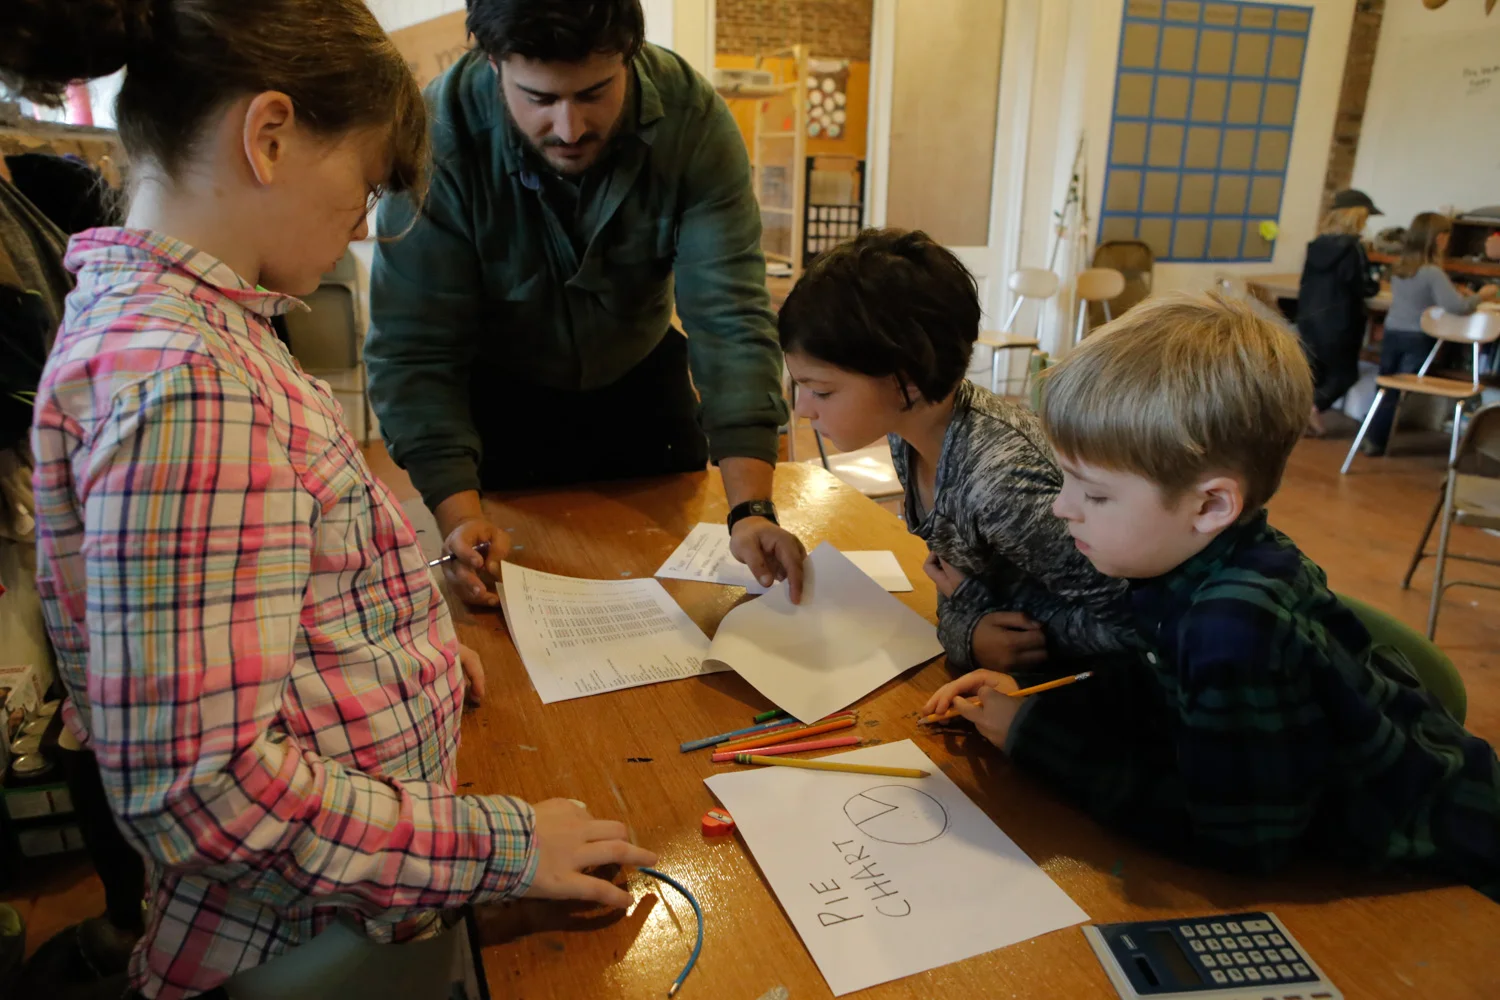
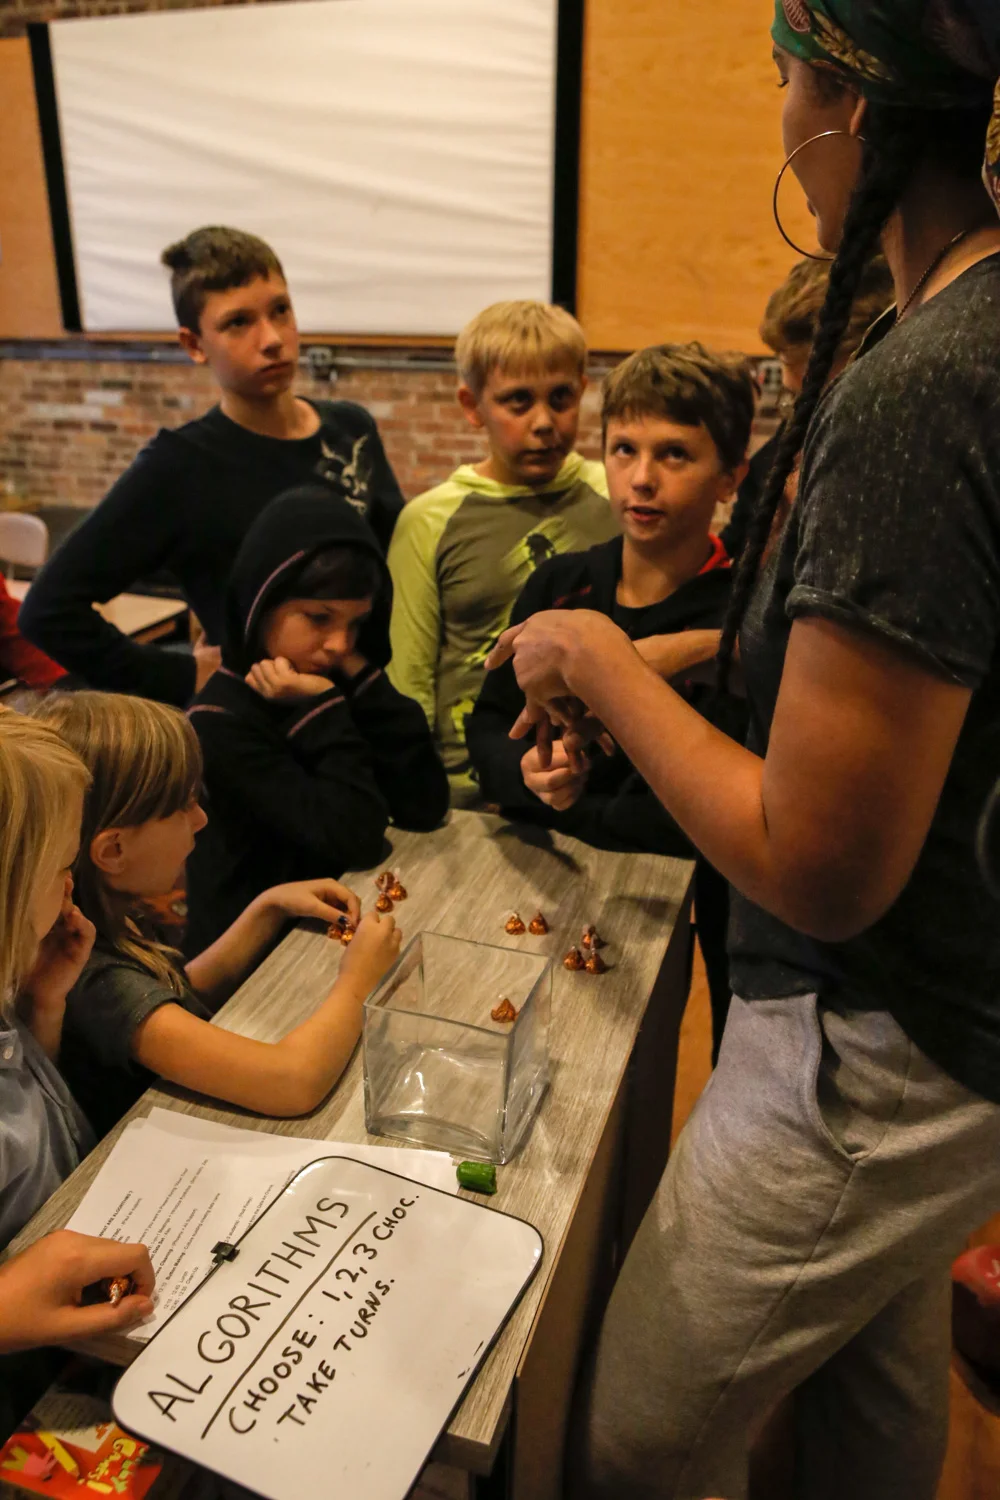
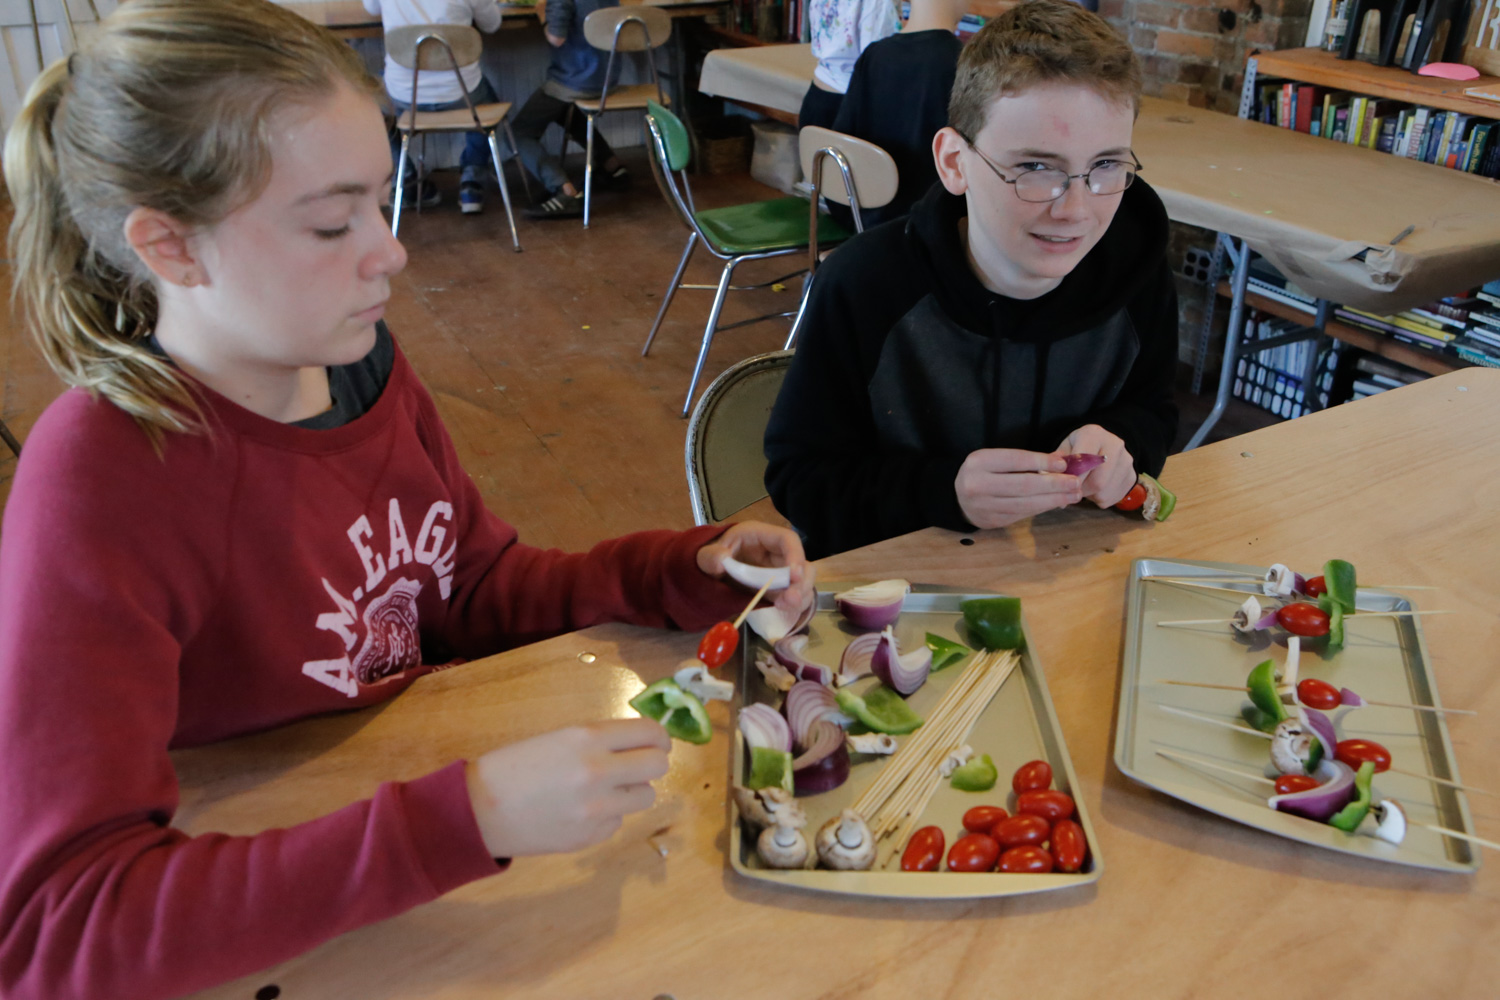
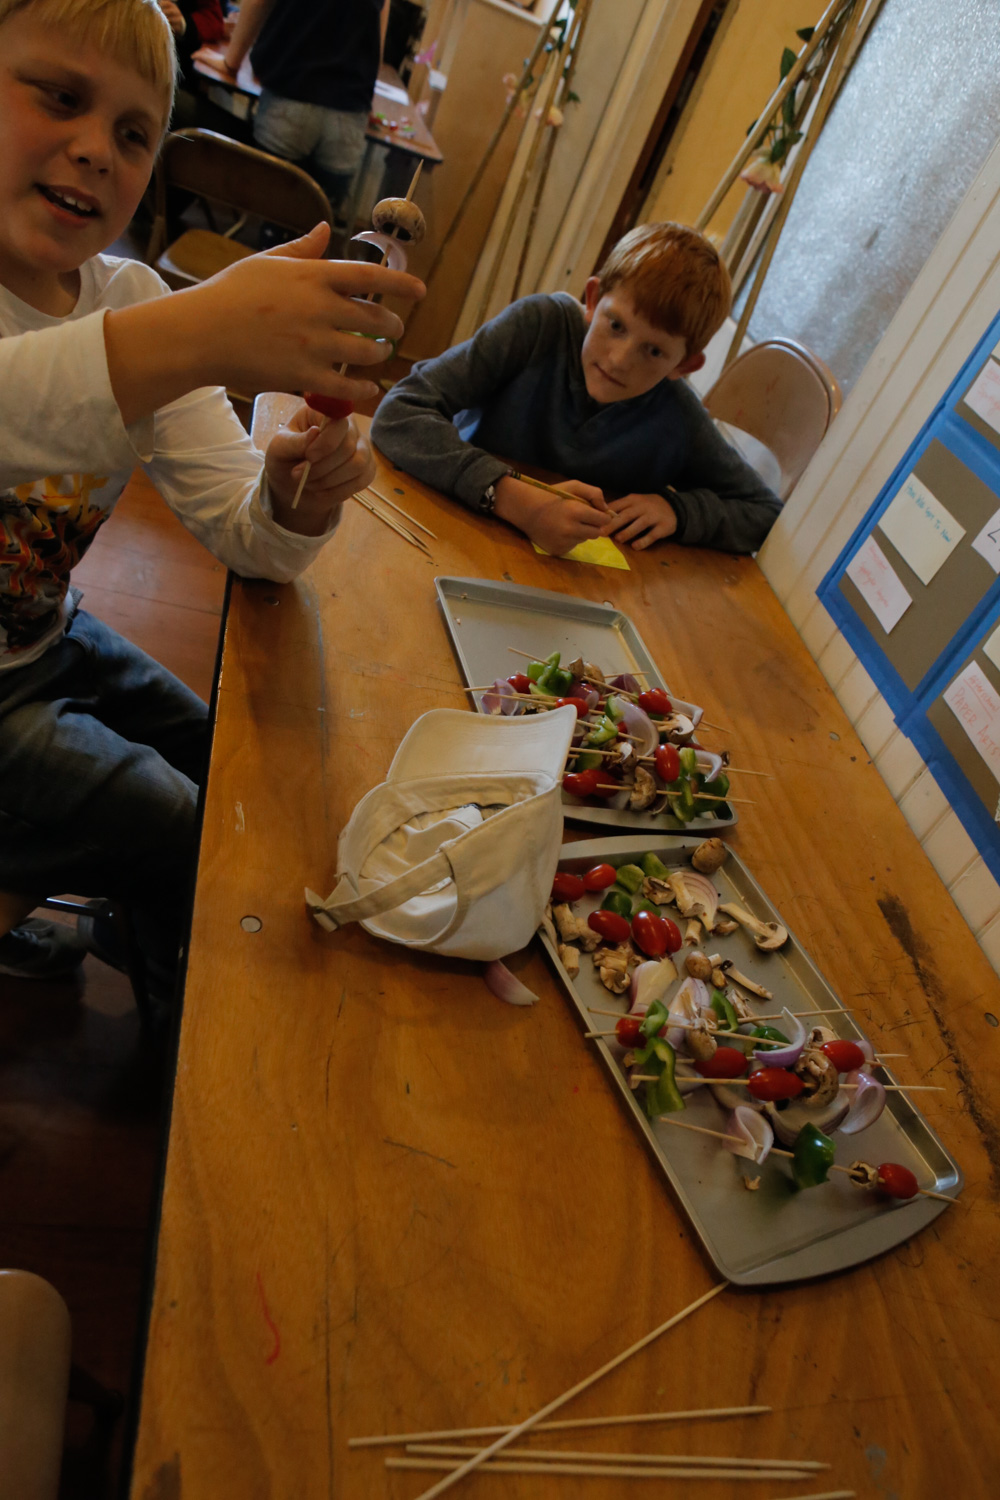
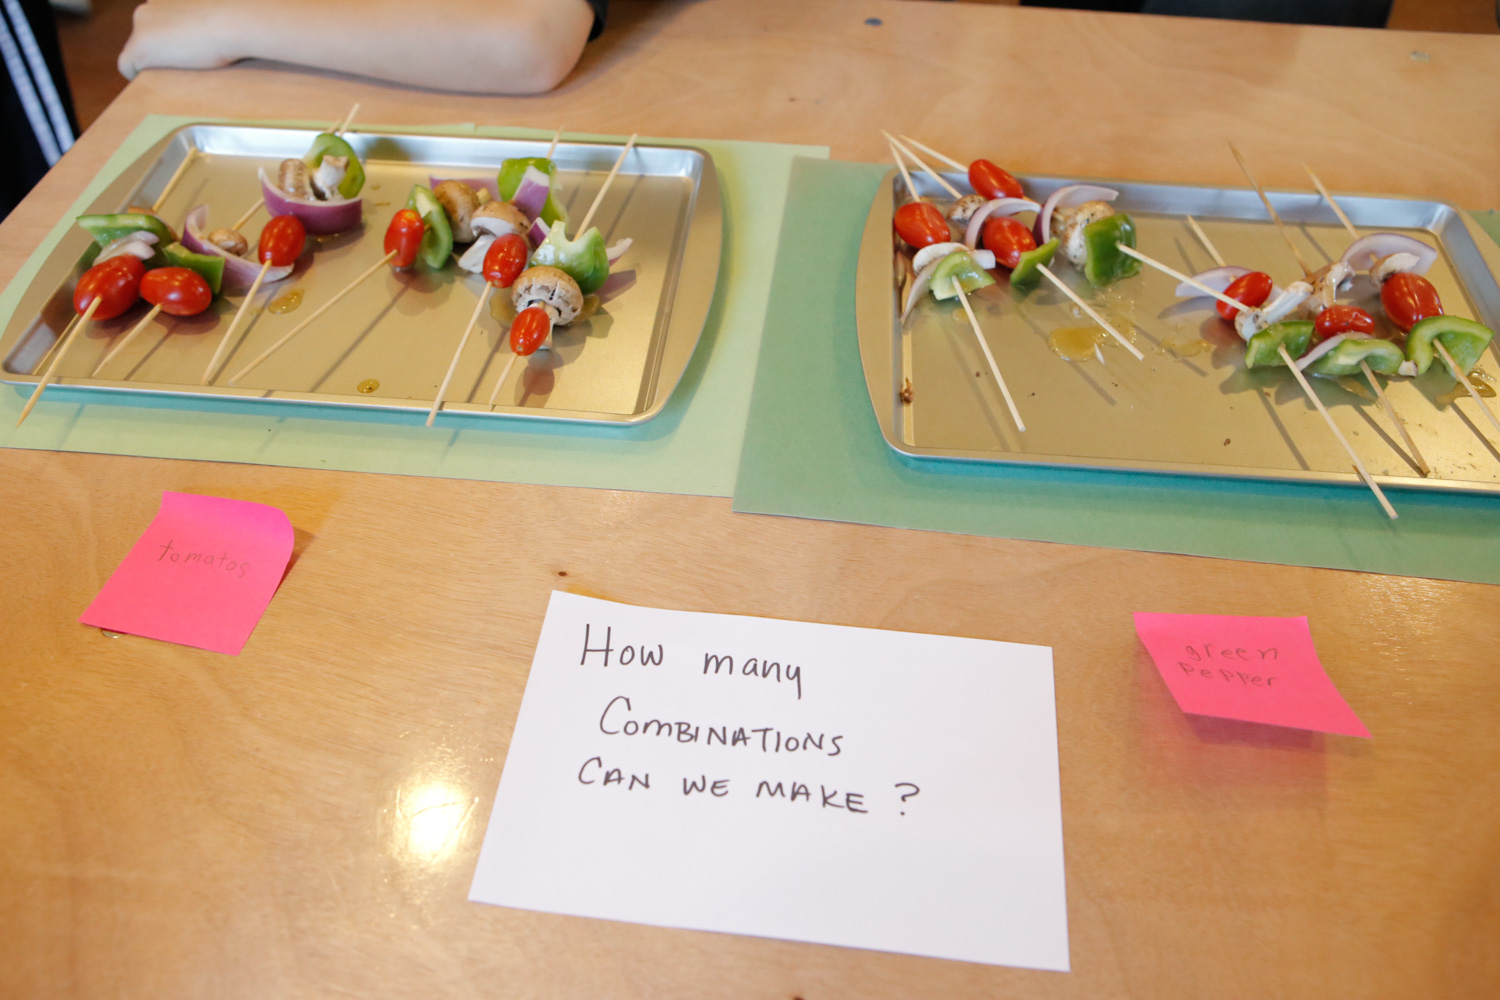
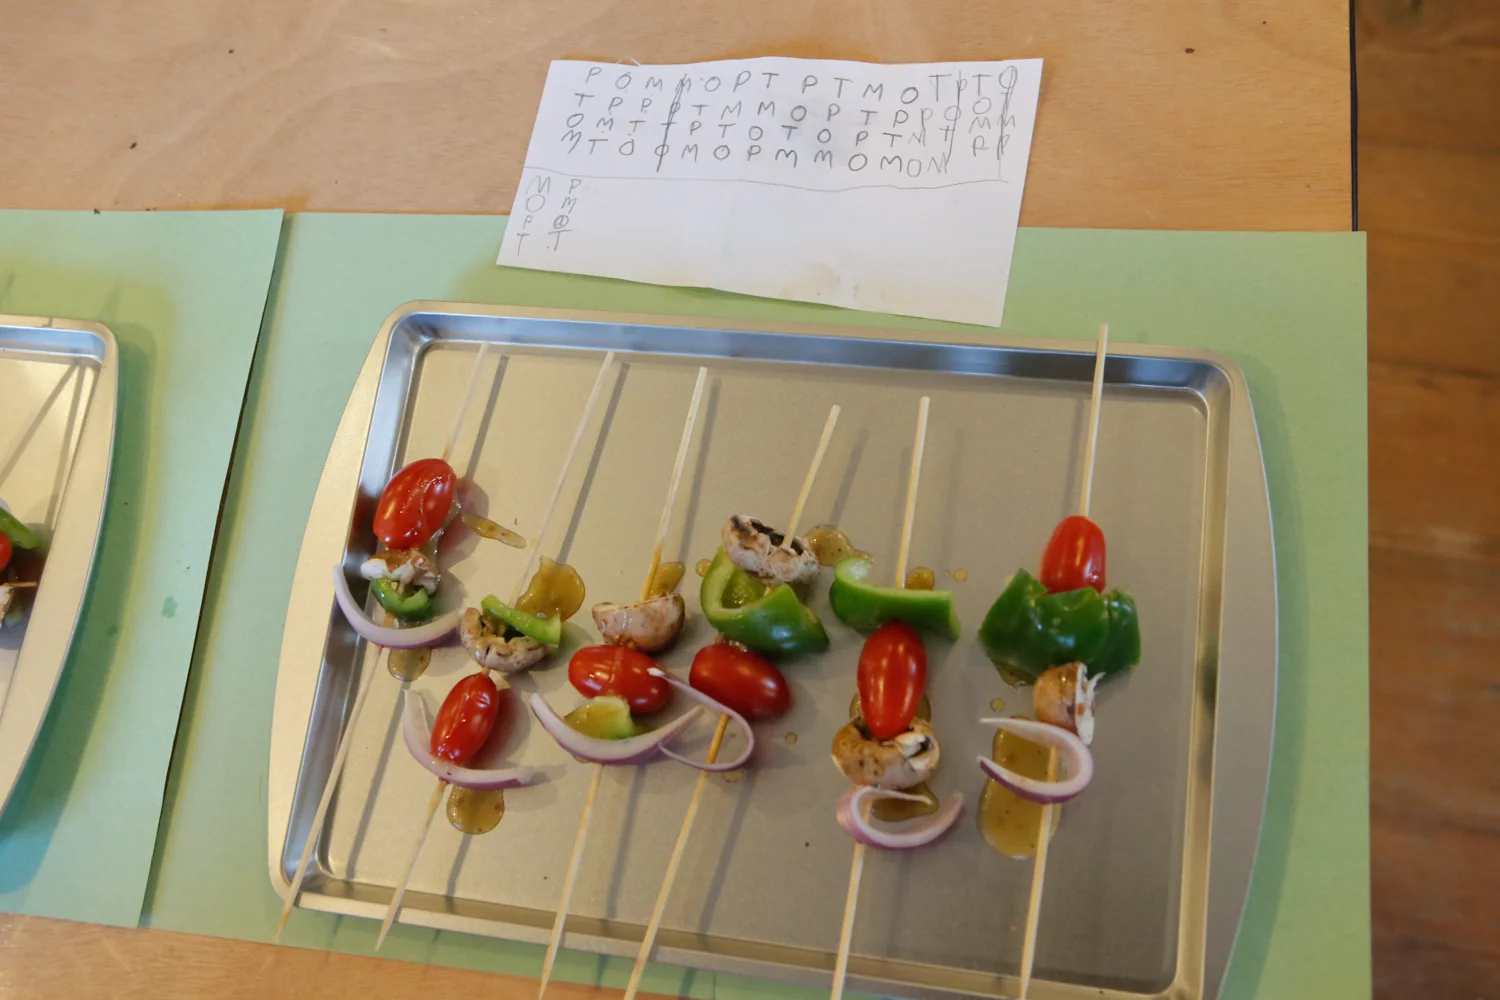
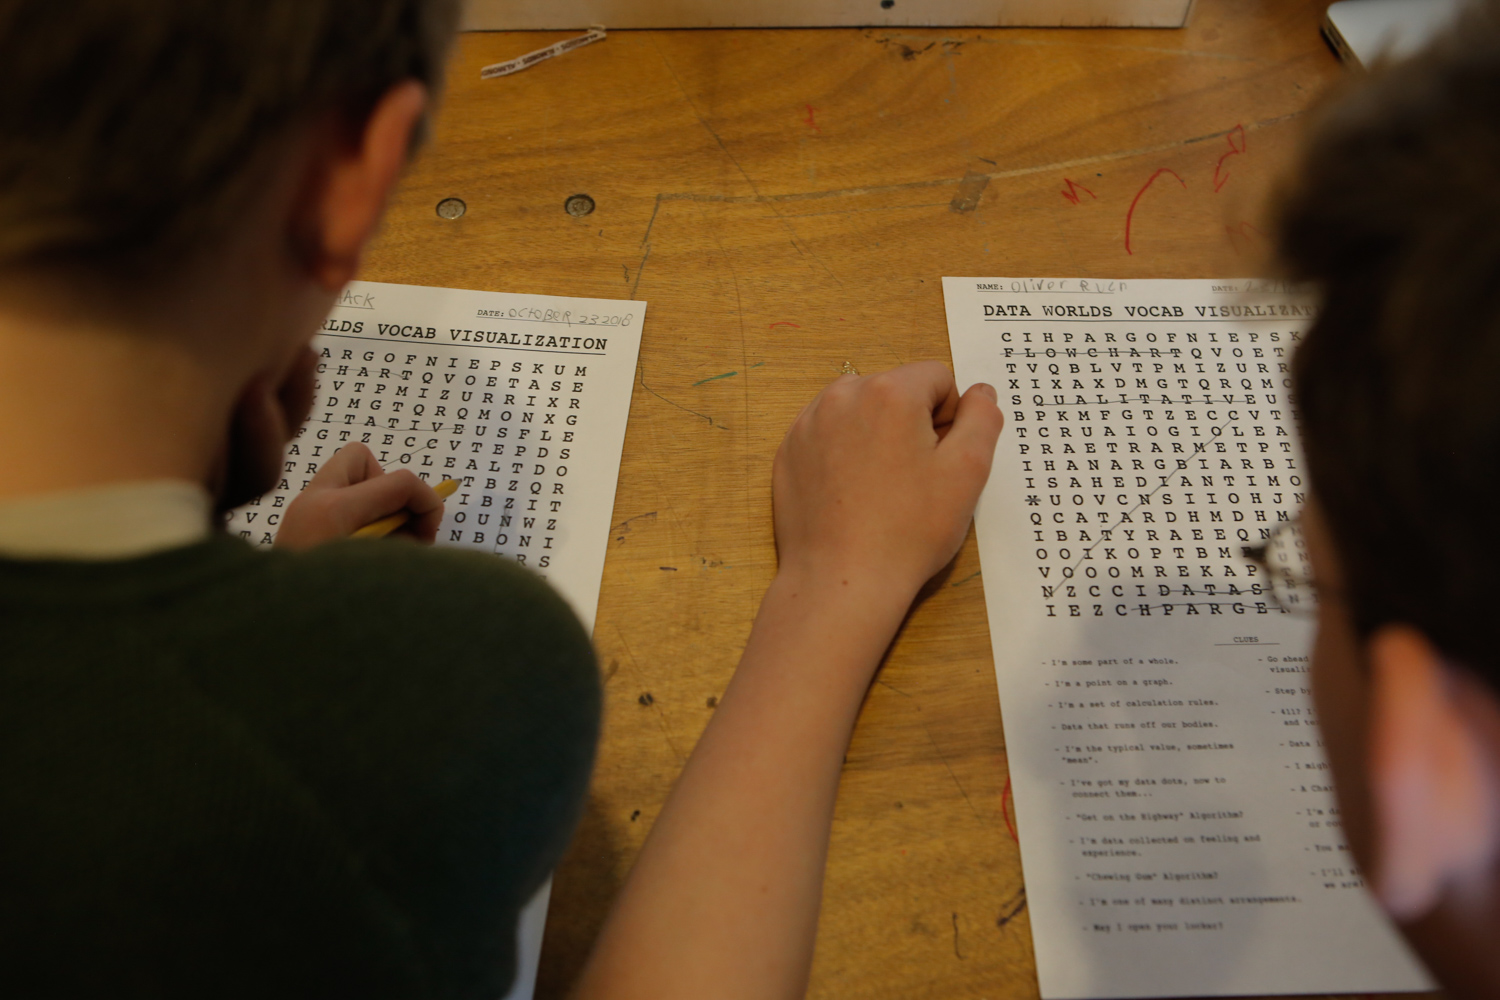
One of our first efforts in developing data-literacy skills was the “Data Art-O-Rama,” in which small groups cycled through data sets, answering questions by creating different styles of graphs. Throughout the semester we learned key vocabulary -- like data set, algorithm, quantitative, qualitative -- to ask: what can and can’t be quantified? Can you quantify intelligence? How about love, hope, or happiness? We learned to read different types of data visuals, like bar graphs, pie charts, isotypes, venn diagrams, flow charts, and maps. We learned about how algorithms -- which pre-date computers by thousands of years -- are the secret ingredient behind all of the technologies in our lives, from Google Search Engines to Artificial Intelligence. With the use of wooden blocks cut in the woodshop, we practiced two types of popular algorithms: the Bubble Sort and Merge Sort Algorithm. Through an activity called the “Griller’s Dilemma” we created Math Kebabs to explore the difference between combinations and permutations using green peppers, onions, tomatoes and mushrooms. We learned about coordinate graphs used for finding and plotting data points, until we could all successfully plot coordinates on an X,Y axis, with both negative and positive numbers. Throughout the semester we reviewed our vocabulary regularly, and created tiny books to summarize our learnings.
Data Visualization: Group Projects
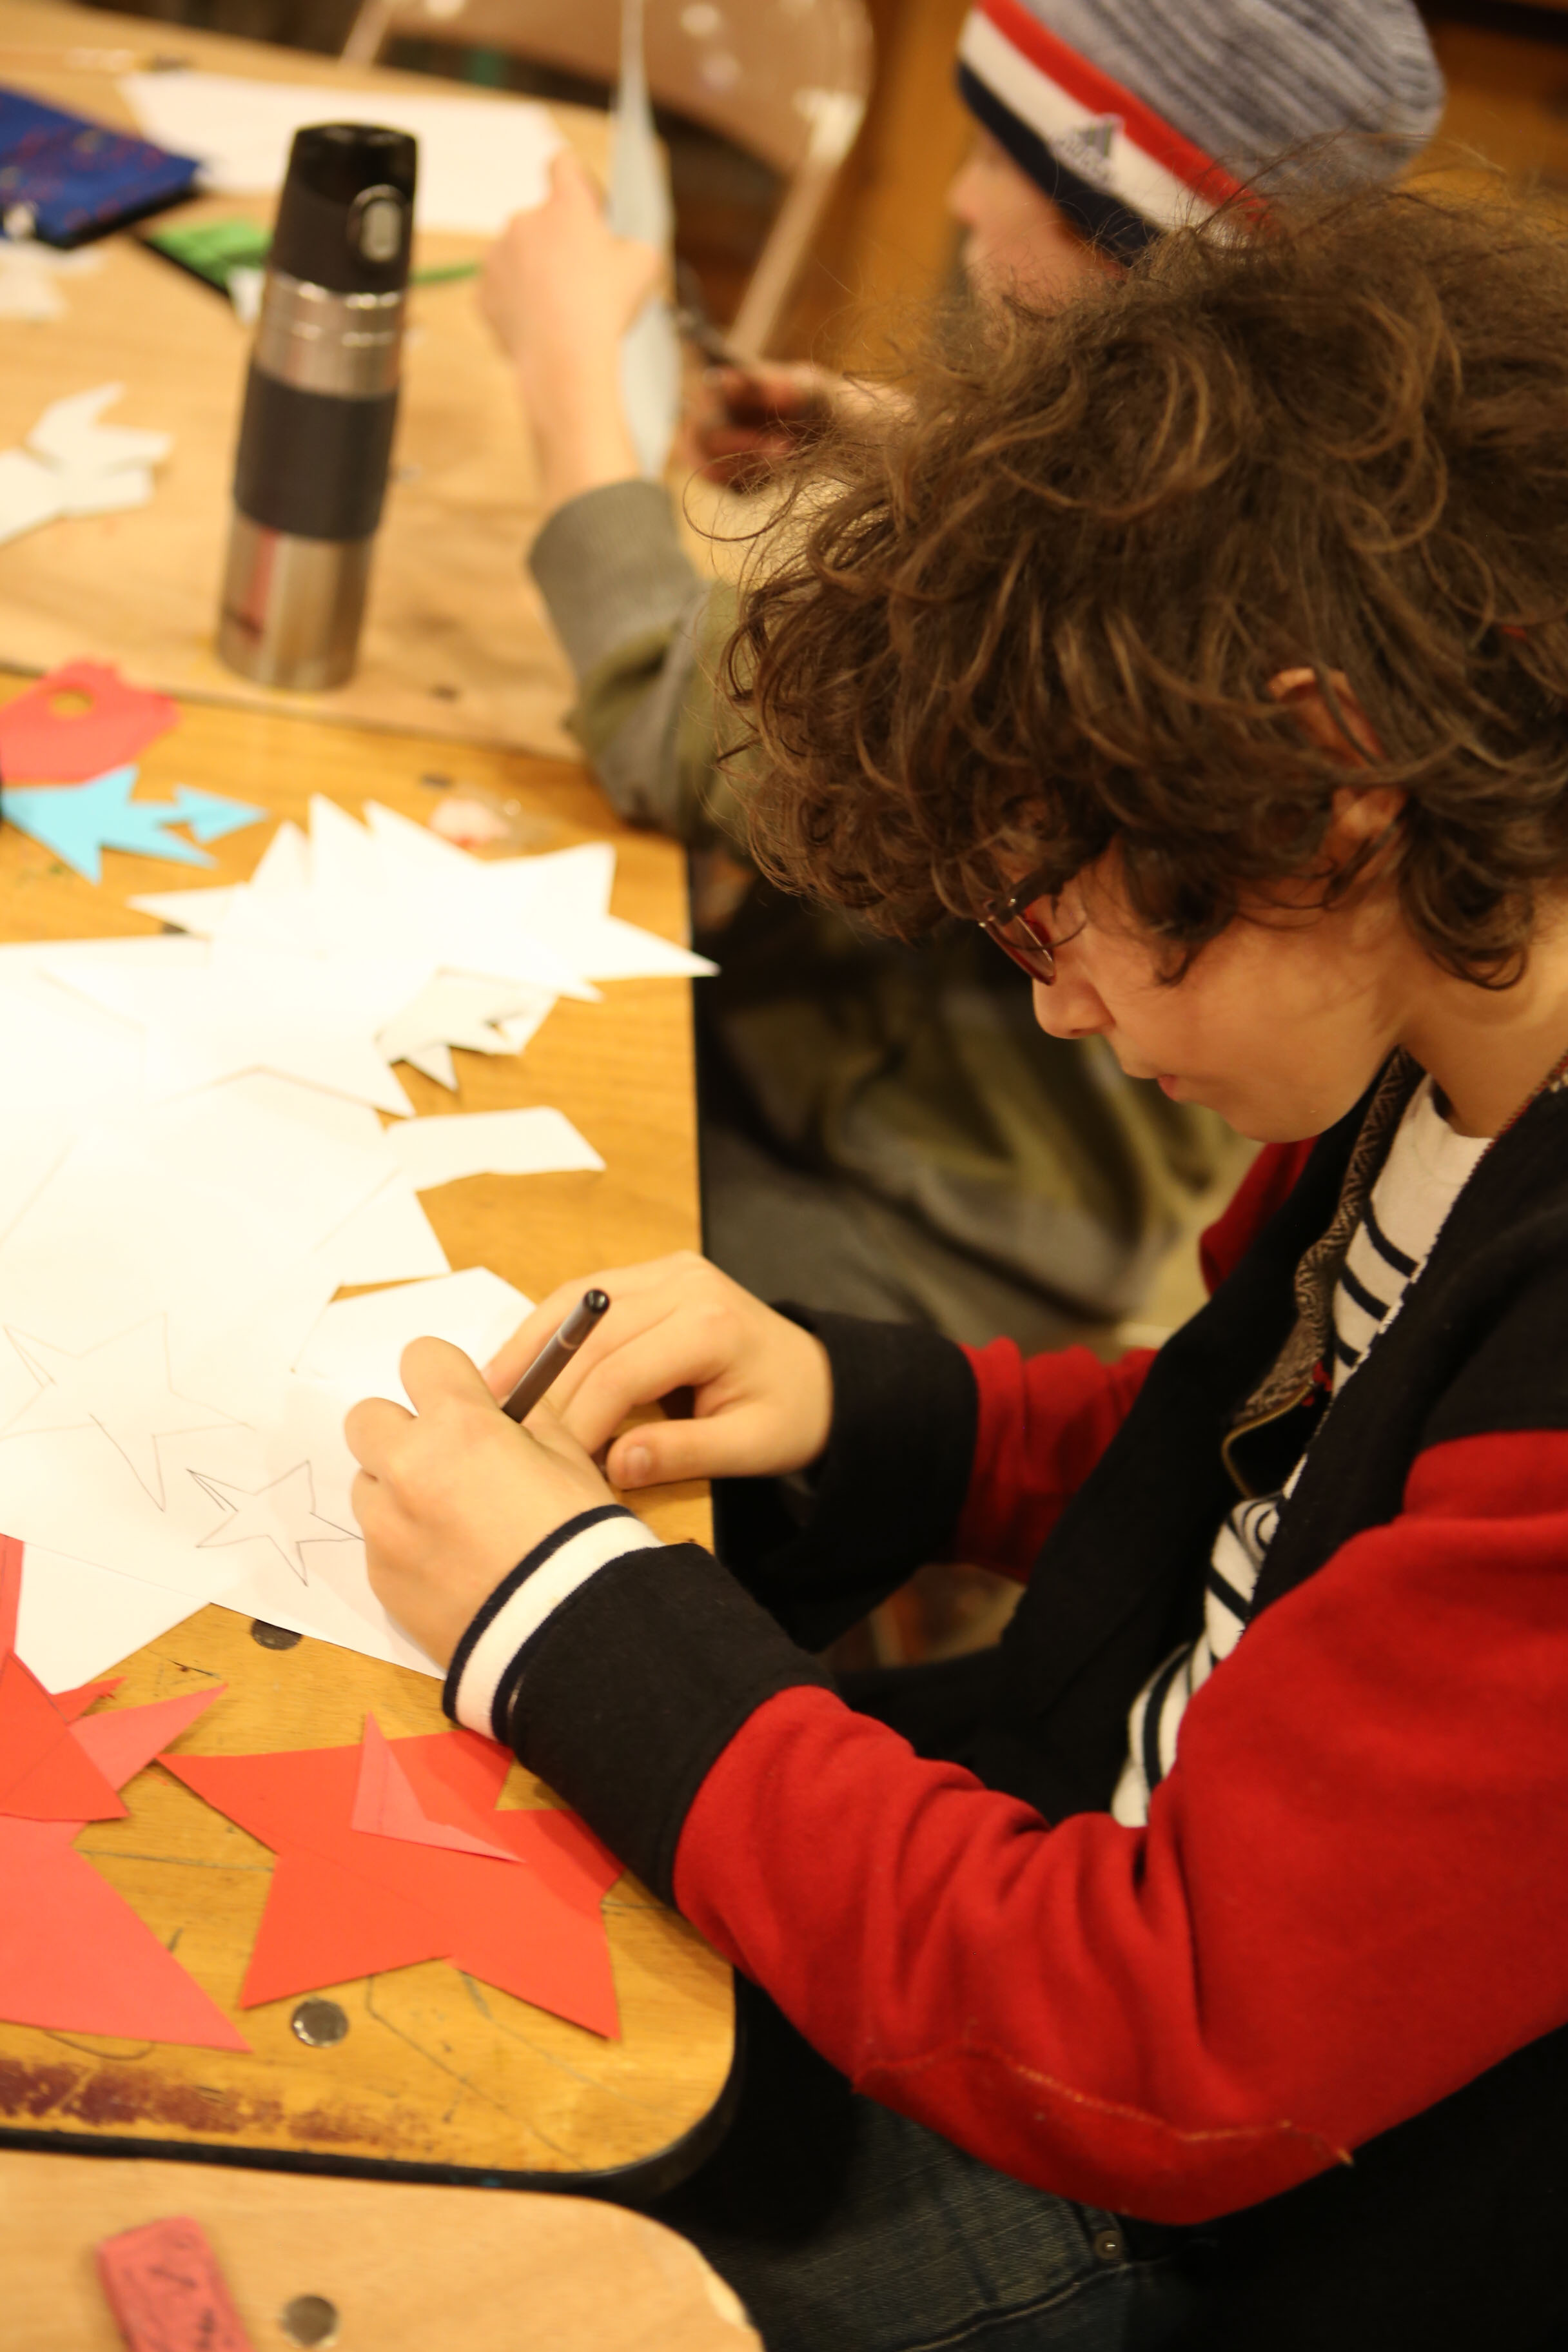
The data and art of food: For our first in-depth exploration of data visualization, we looked at the Food Pyramid as an infographic that many of us are familiar with: examining its source and its impacts on diet trends in order to question how the values and politics within data visuals can influence our choices. We designed our own infographics to visualize our own diets. We unpacked a bag of groceries to research the geographic origins of various food items, using data sheets, a globe, google maps, a string, and clothespin to synthesize and visualize data about how far our food had traveled.
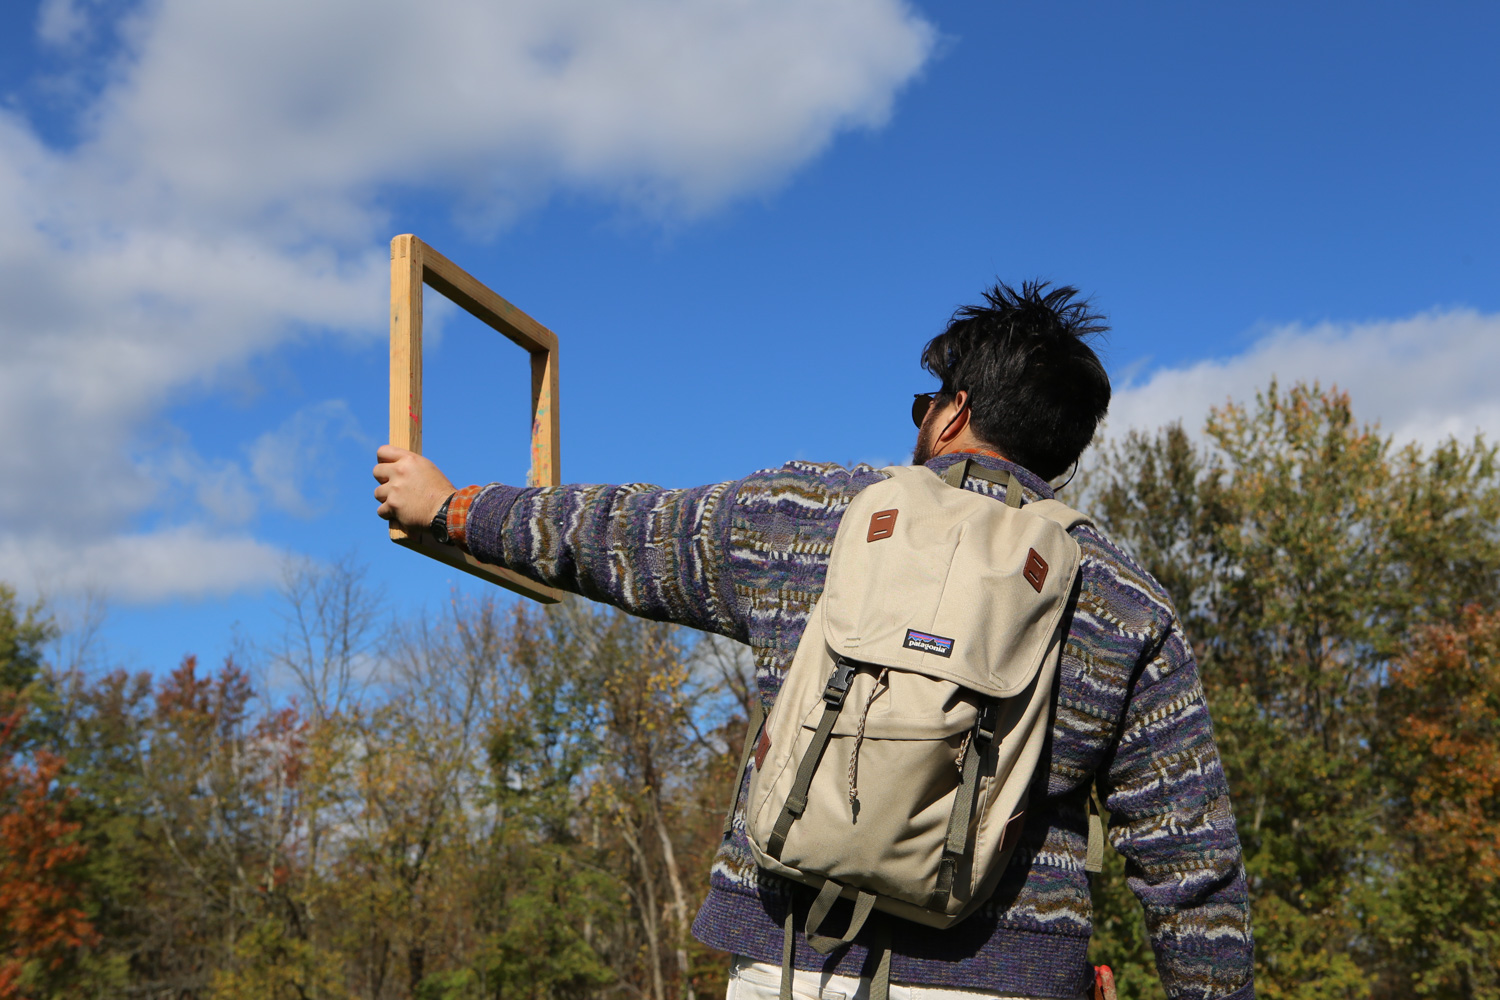
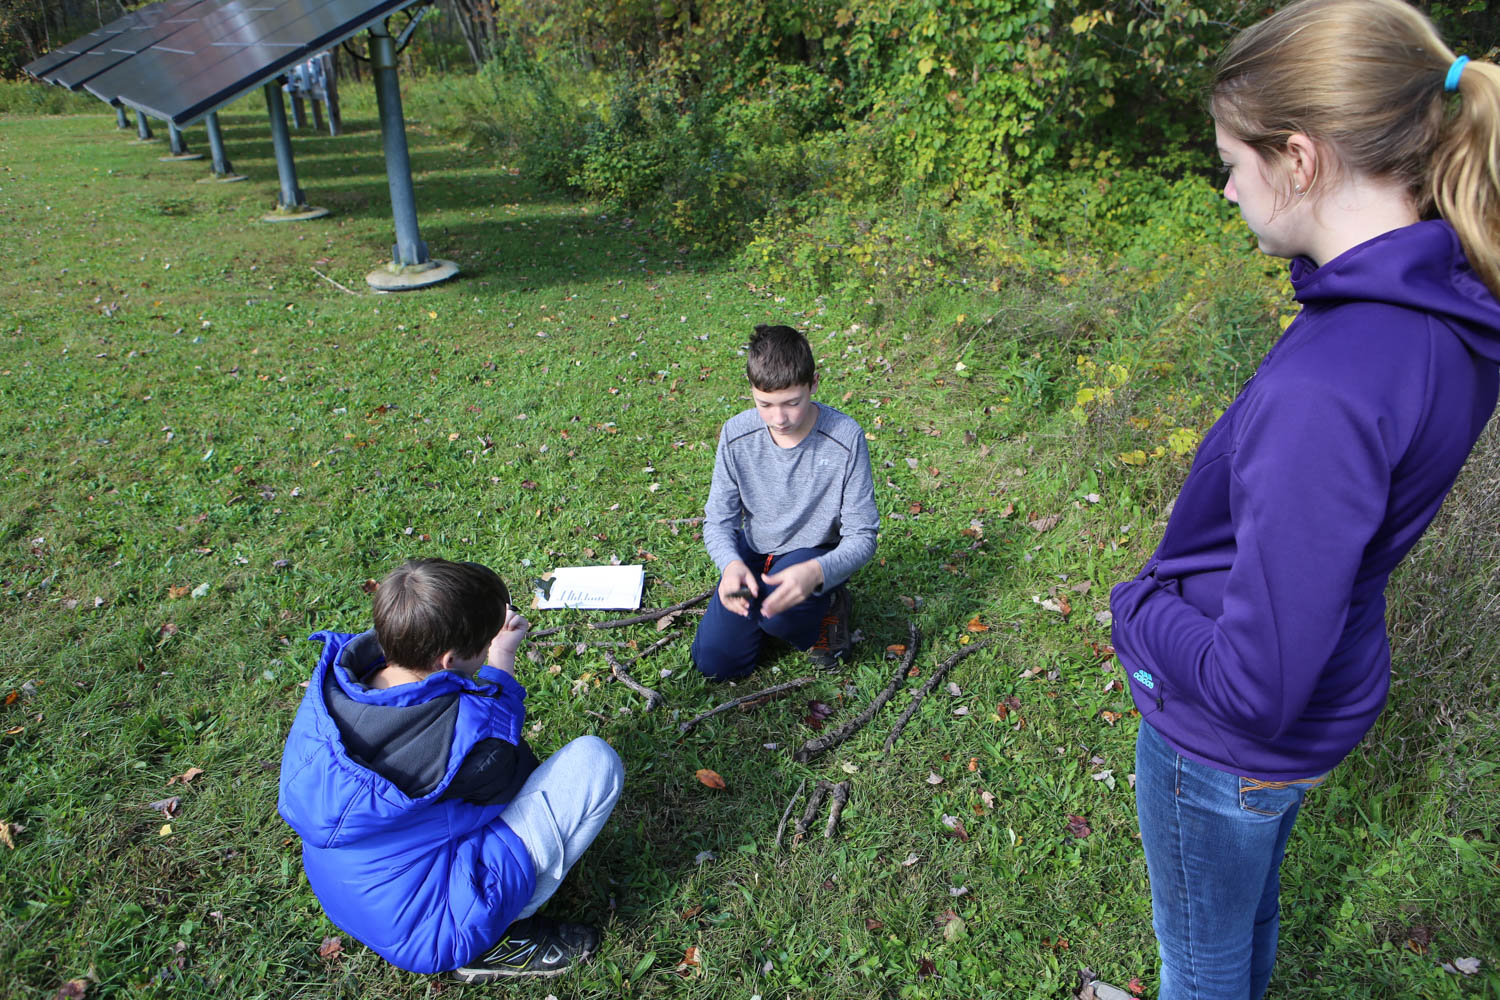
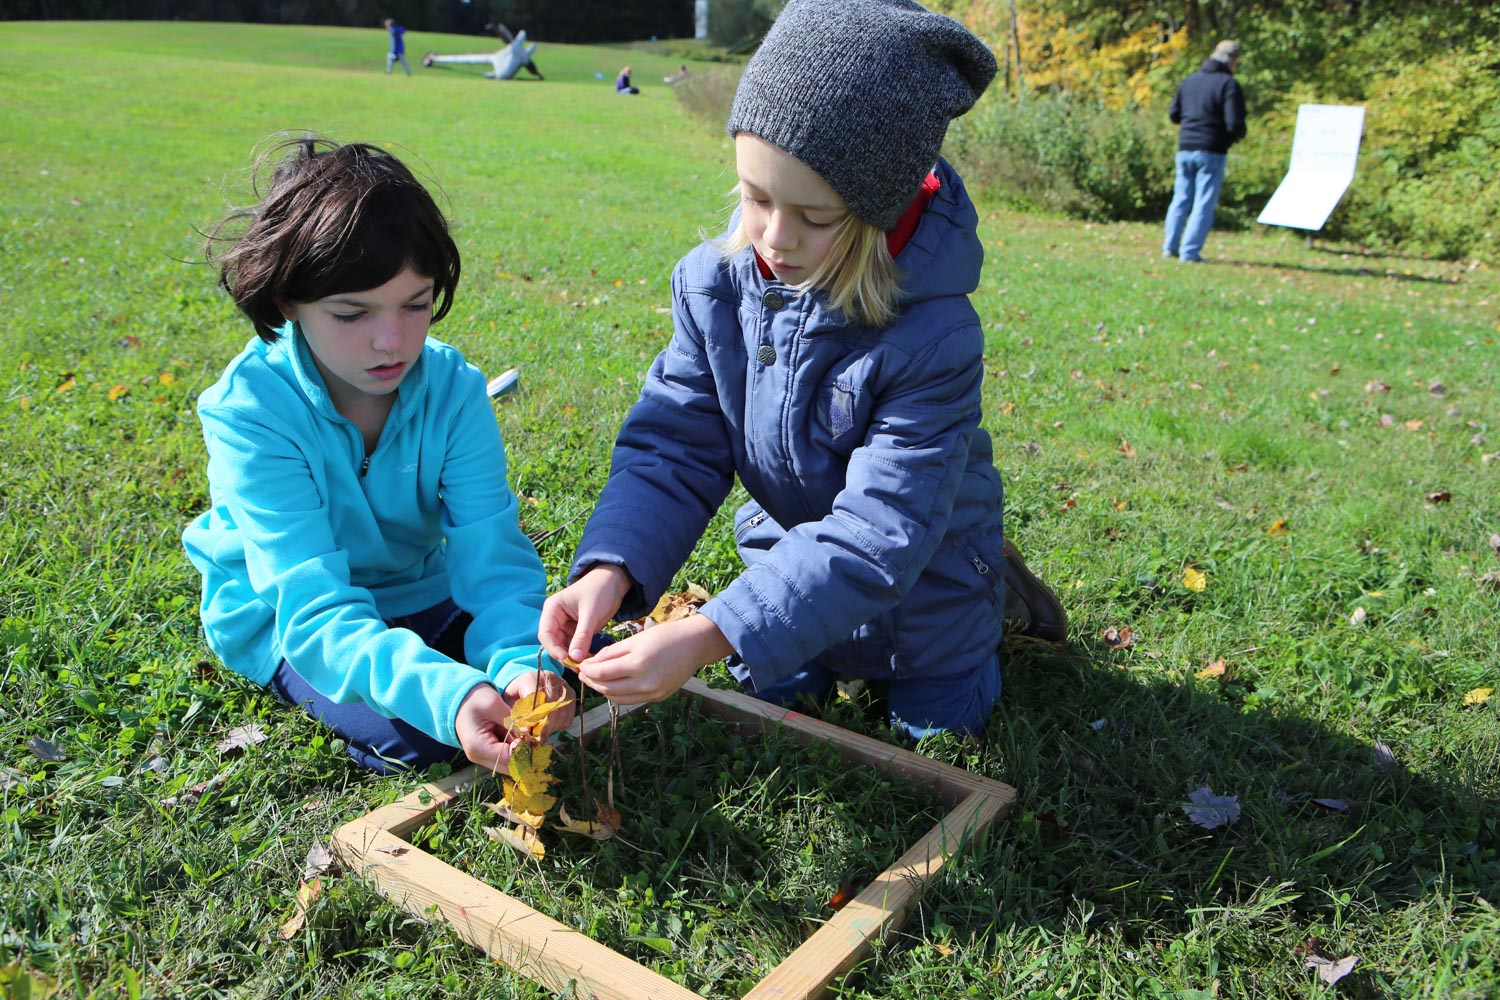
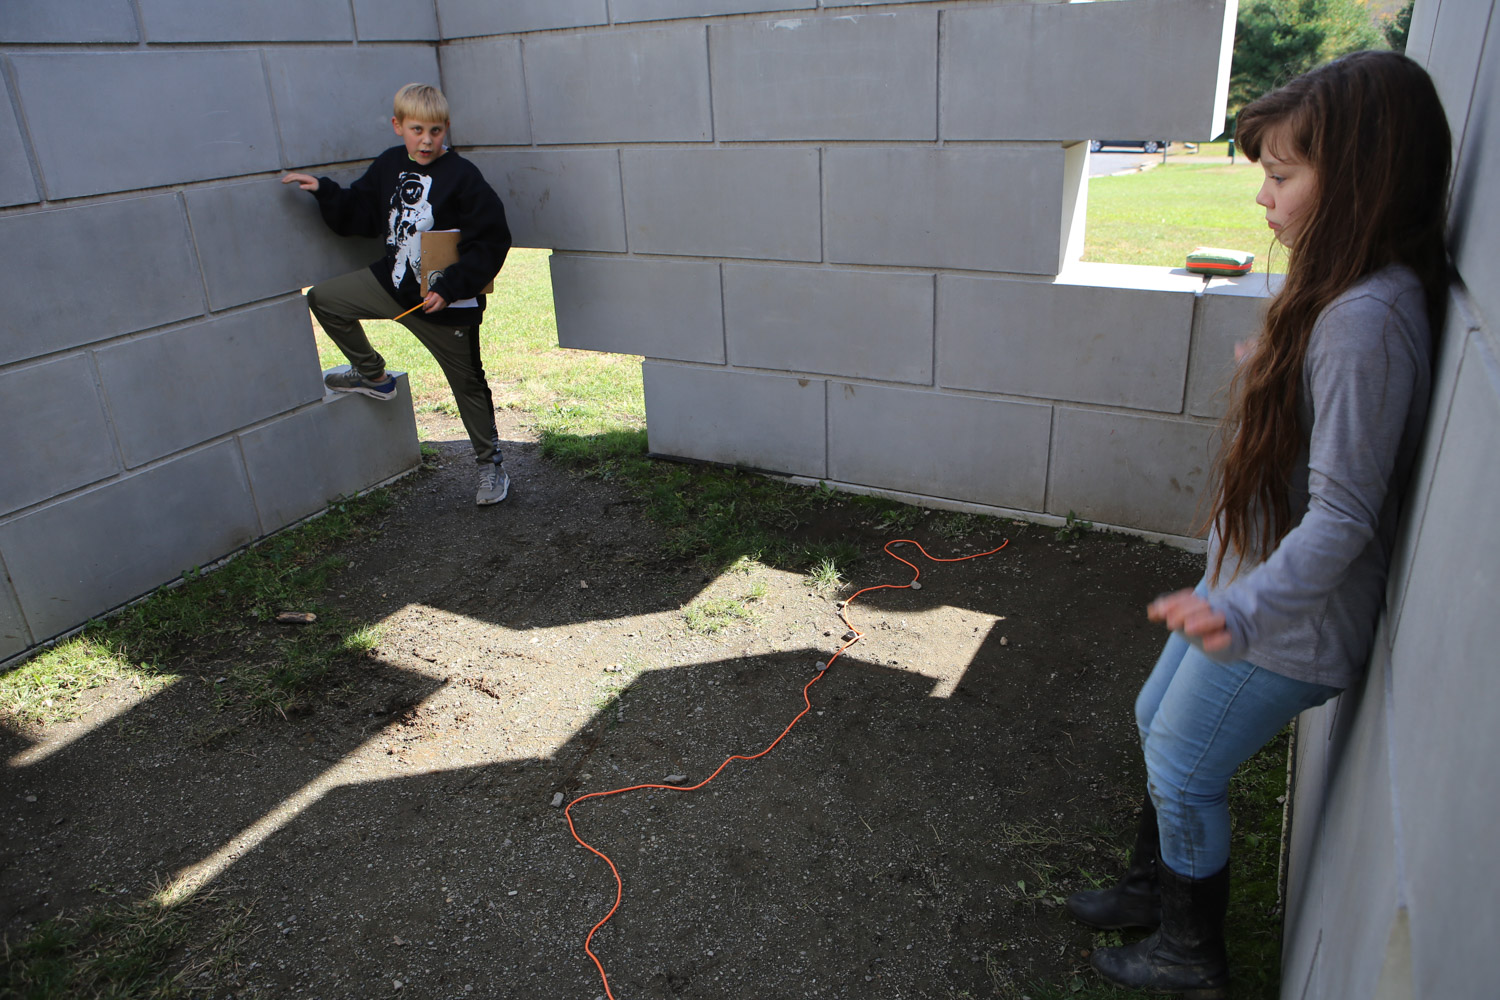
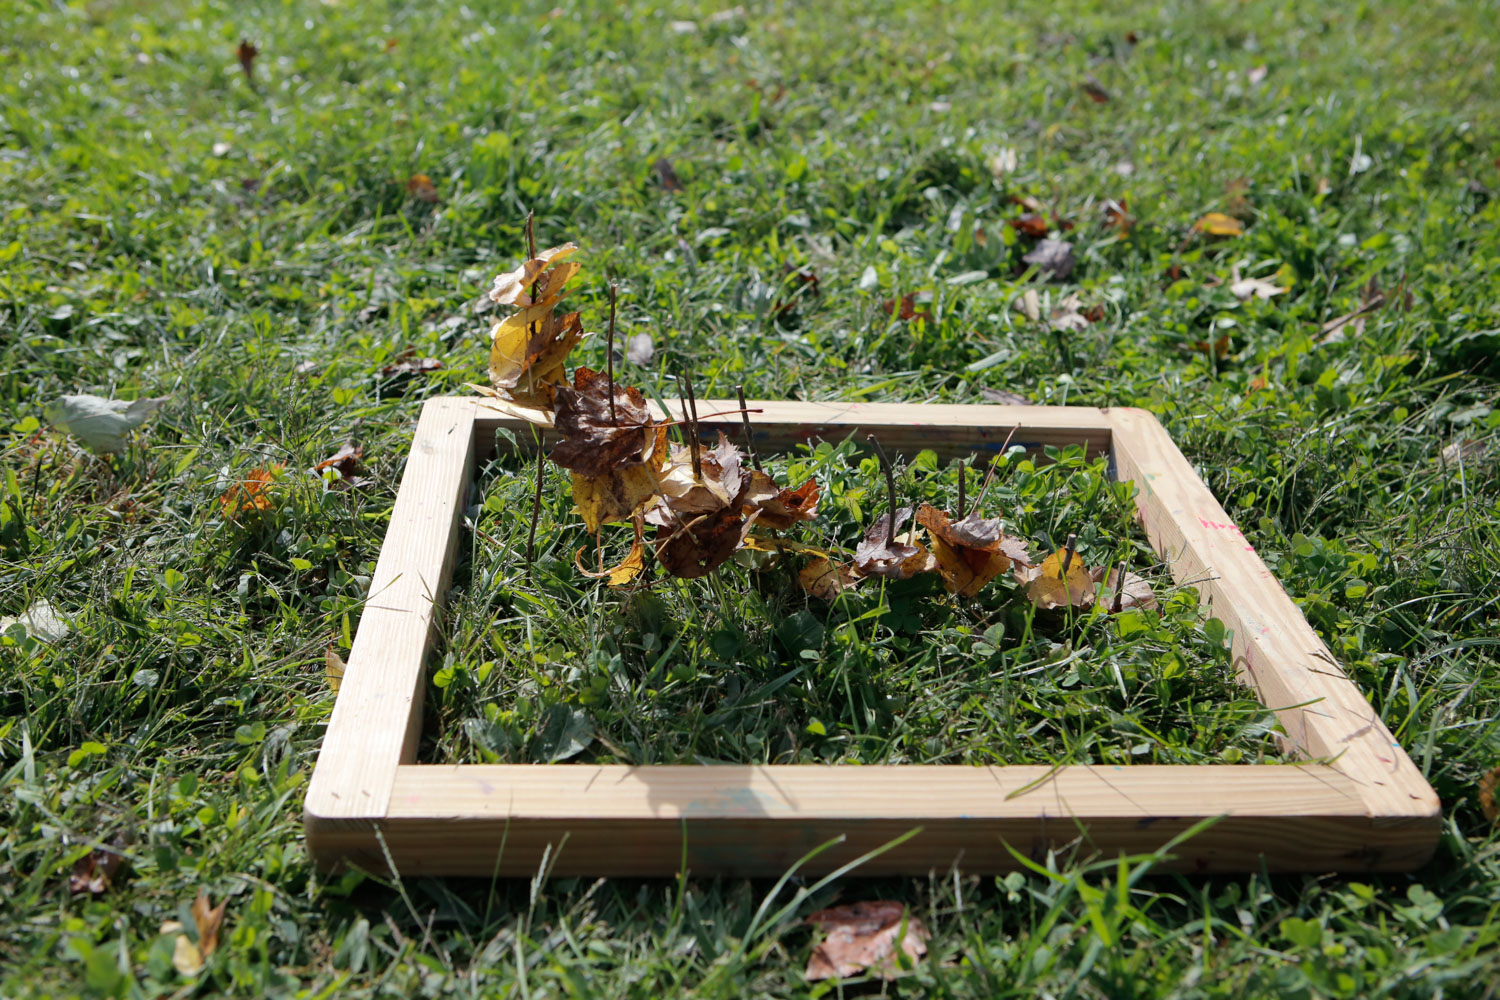
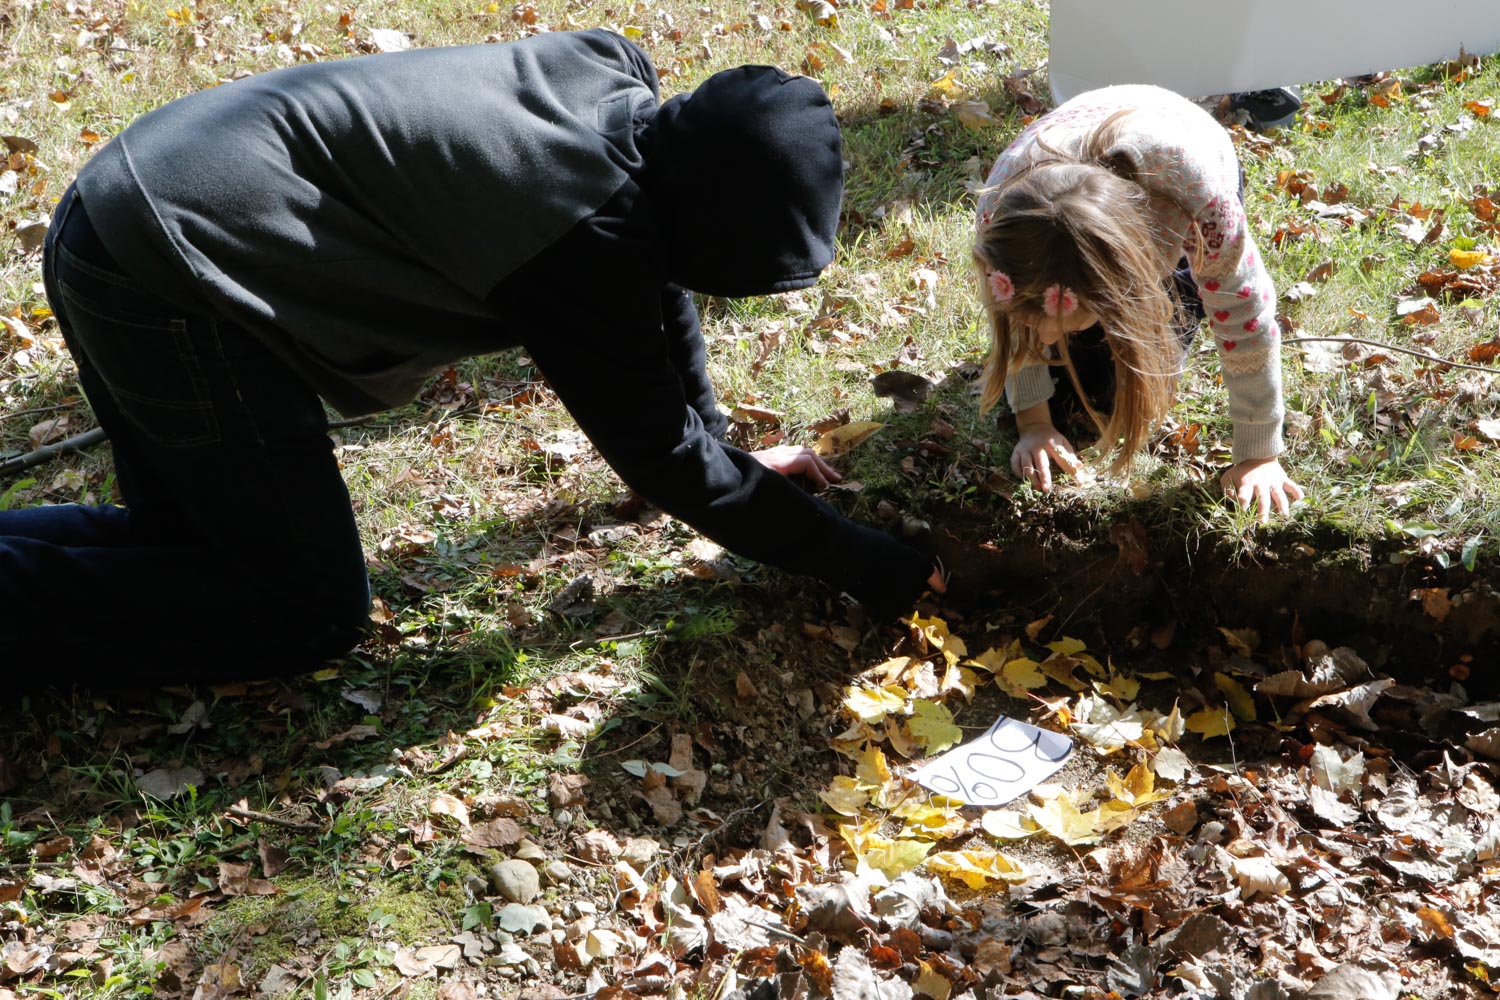
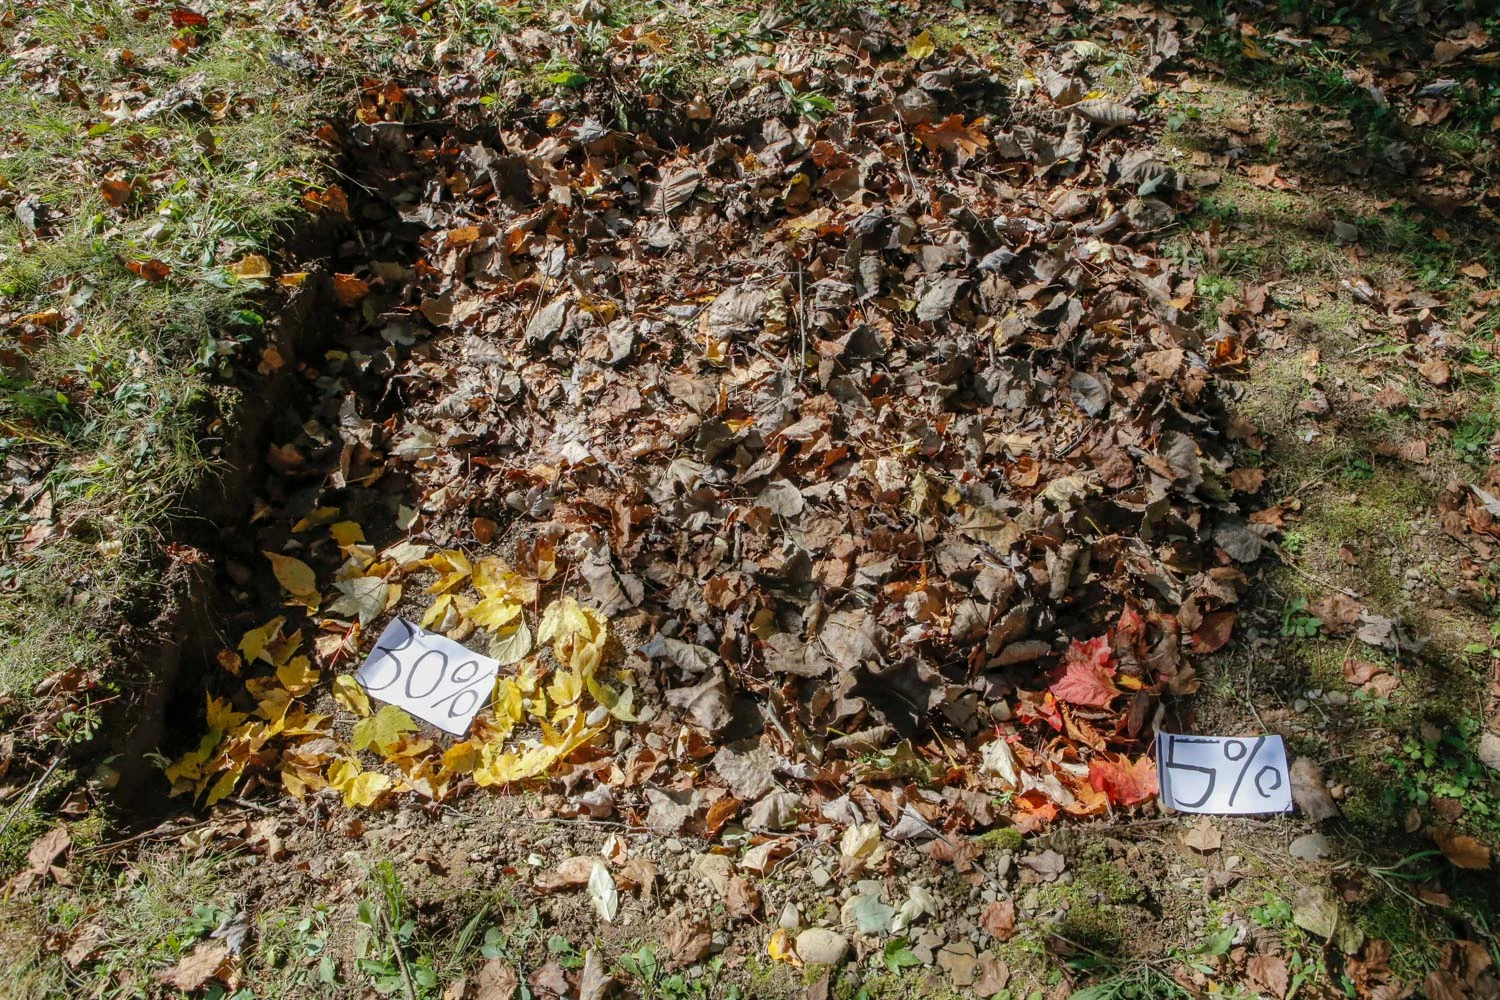
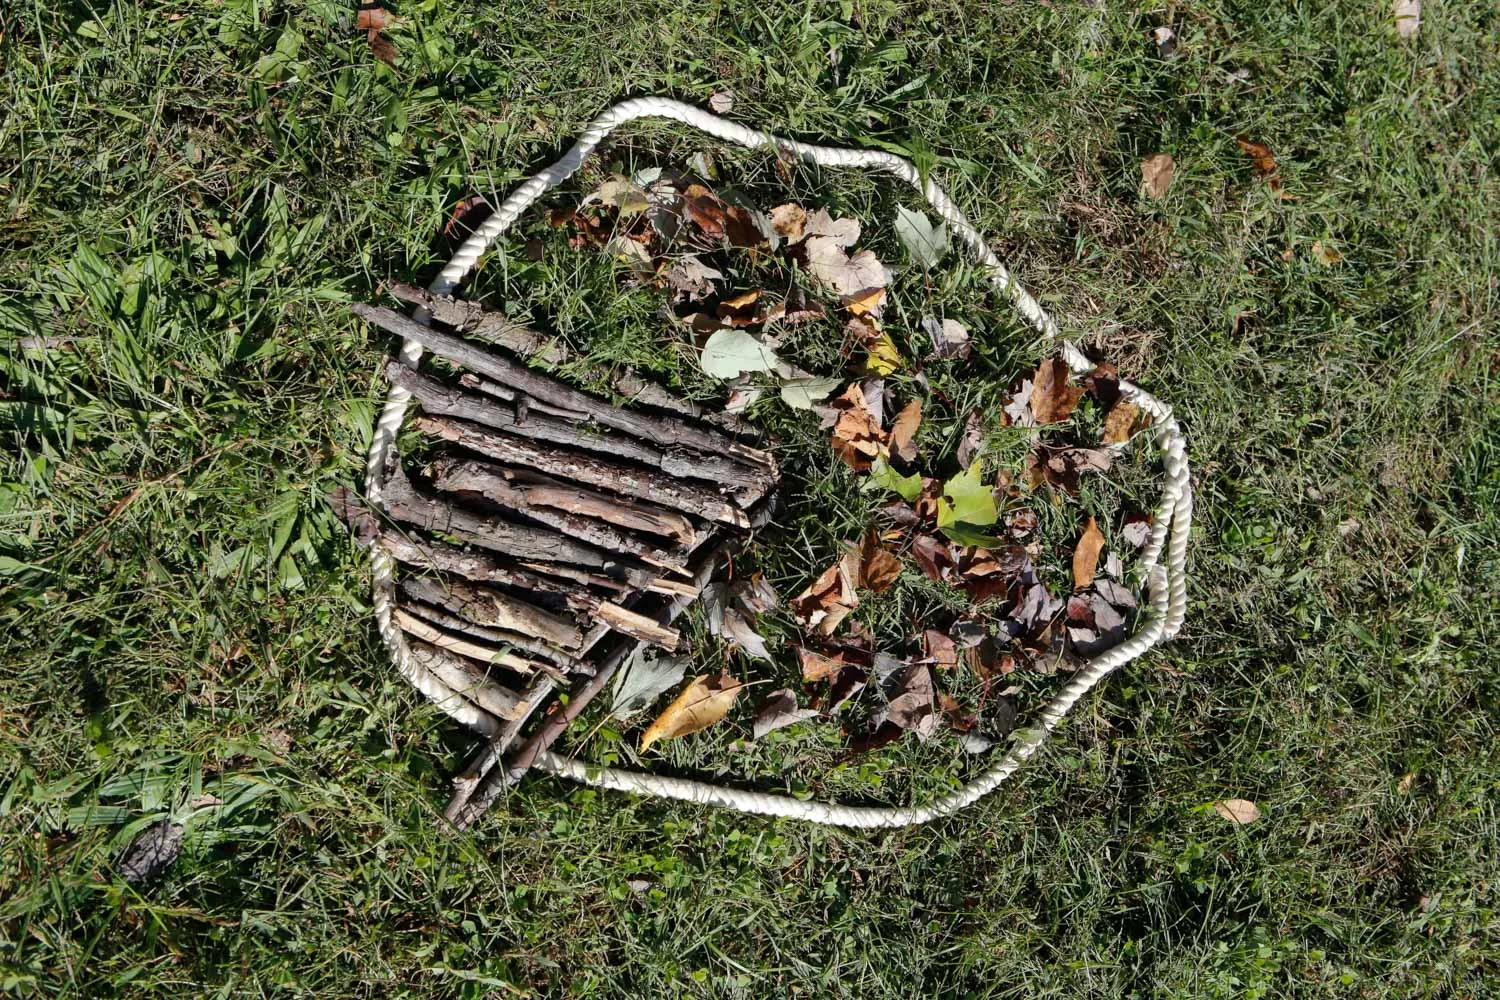
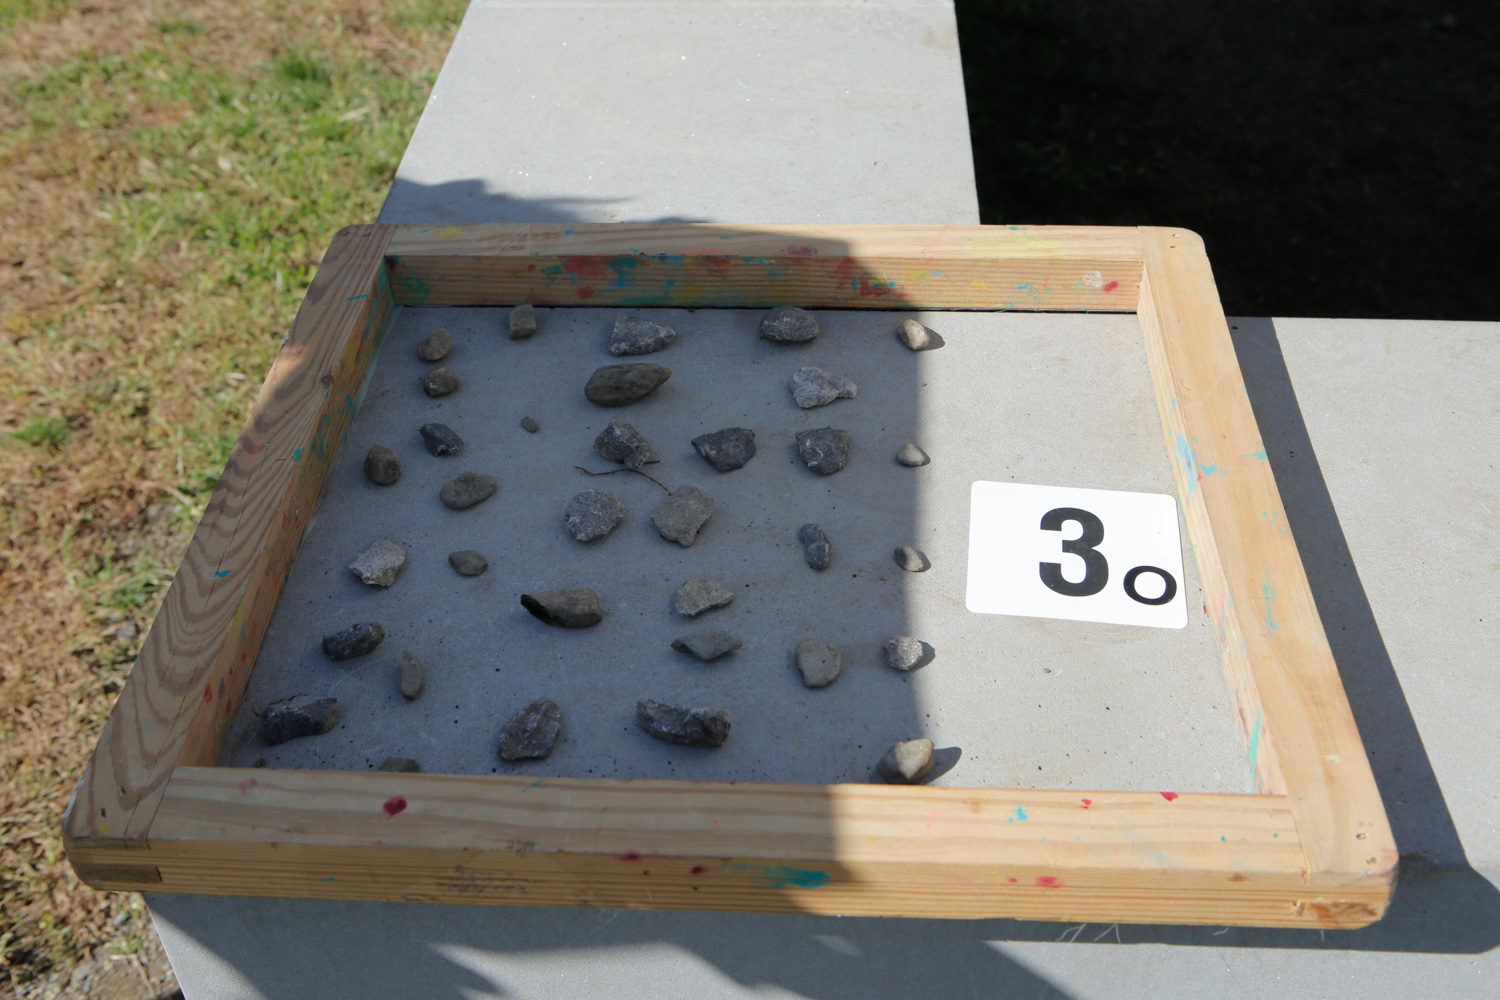
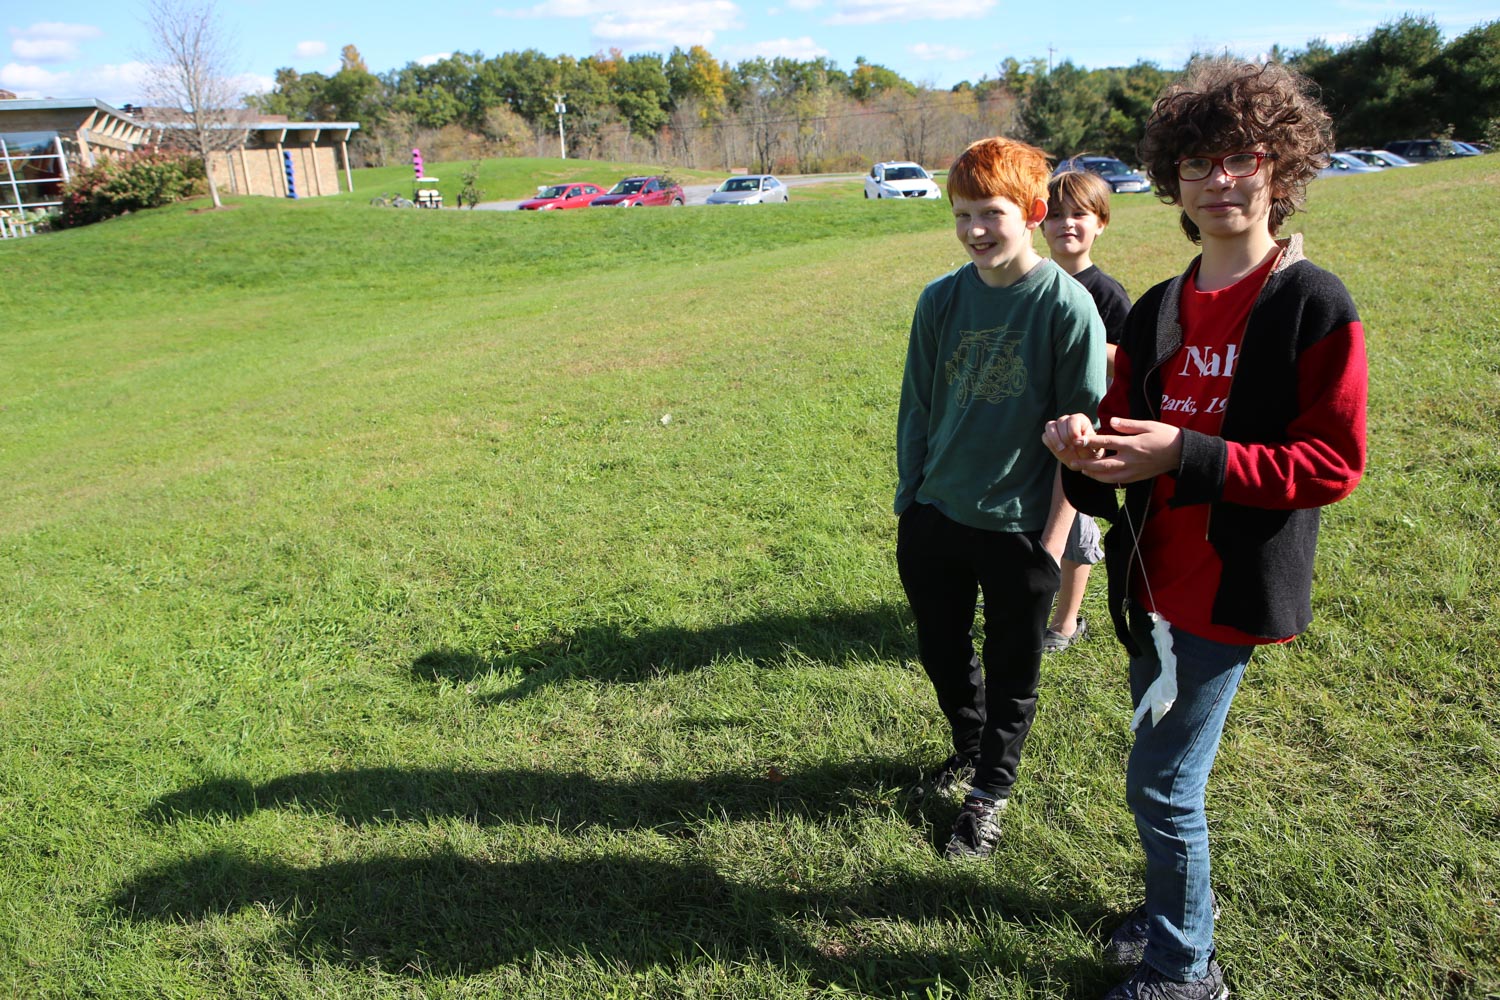
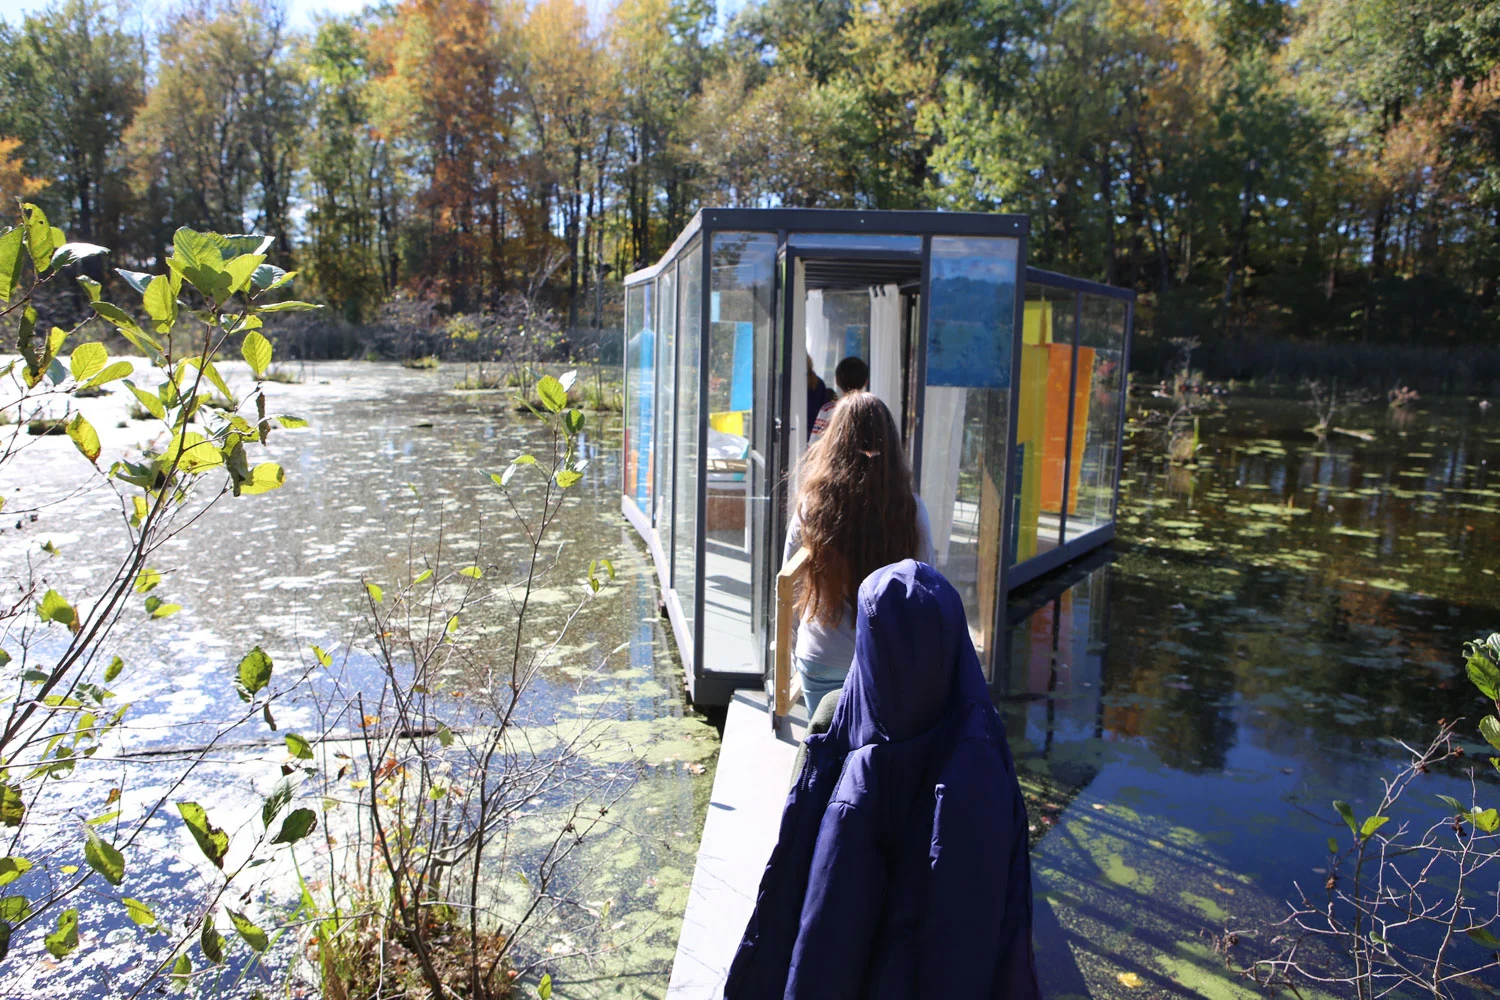
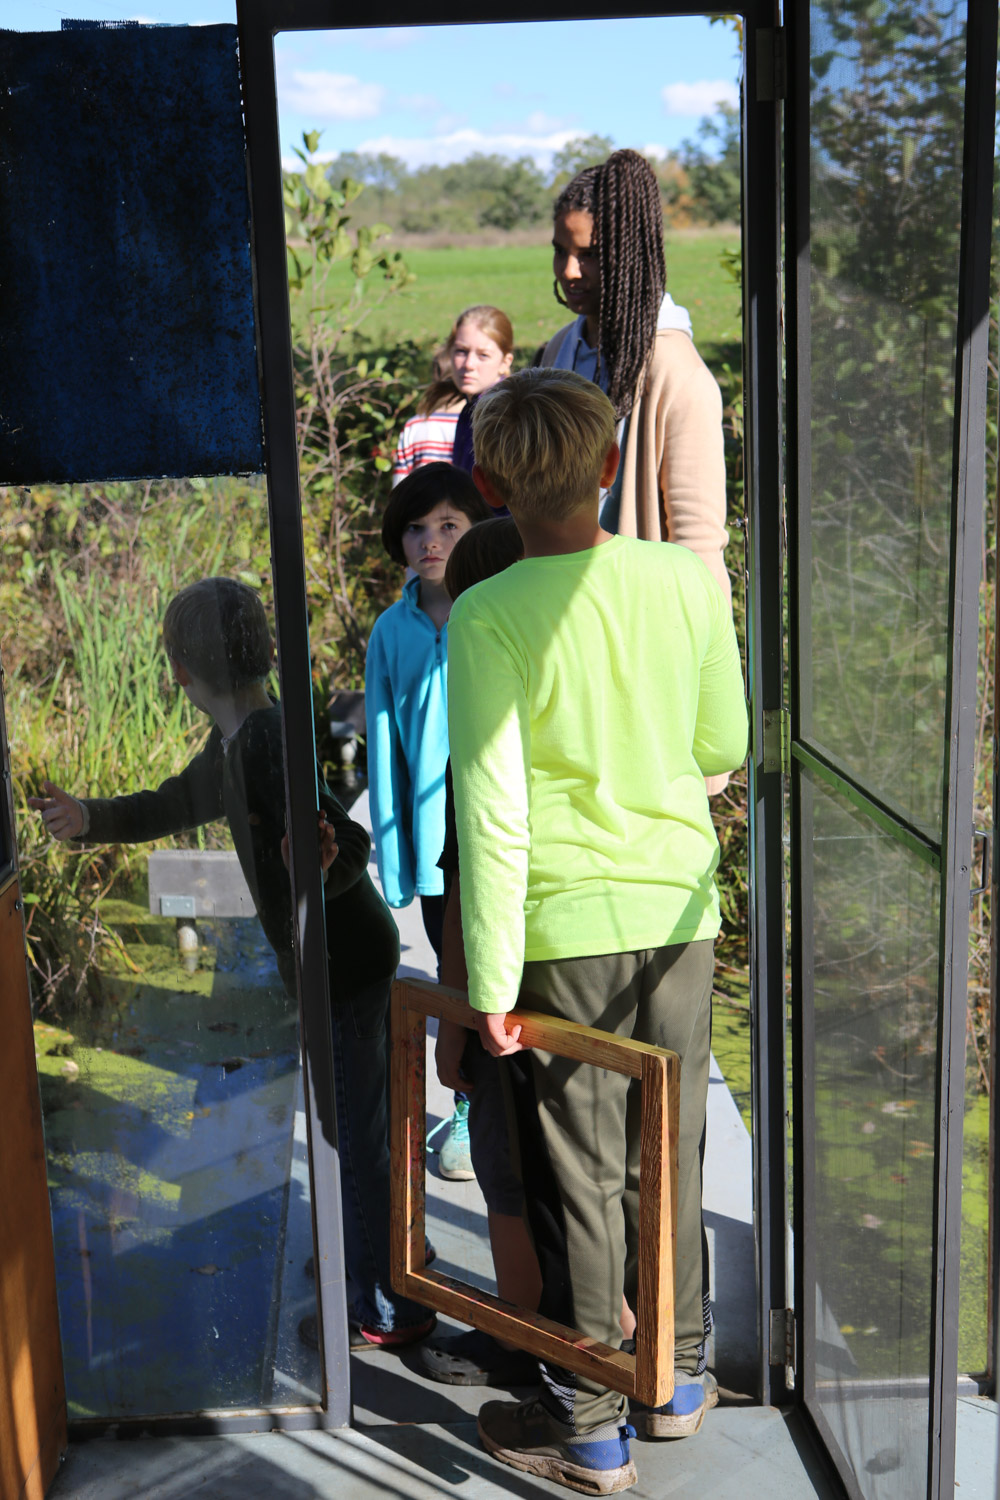
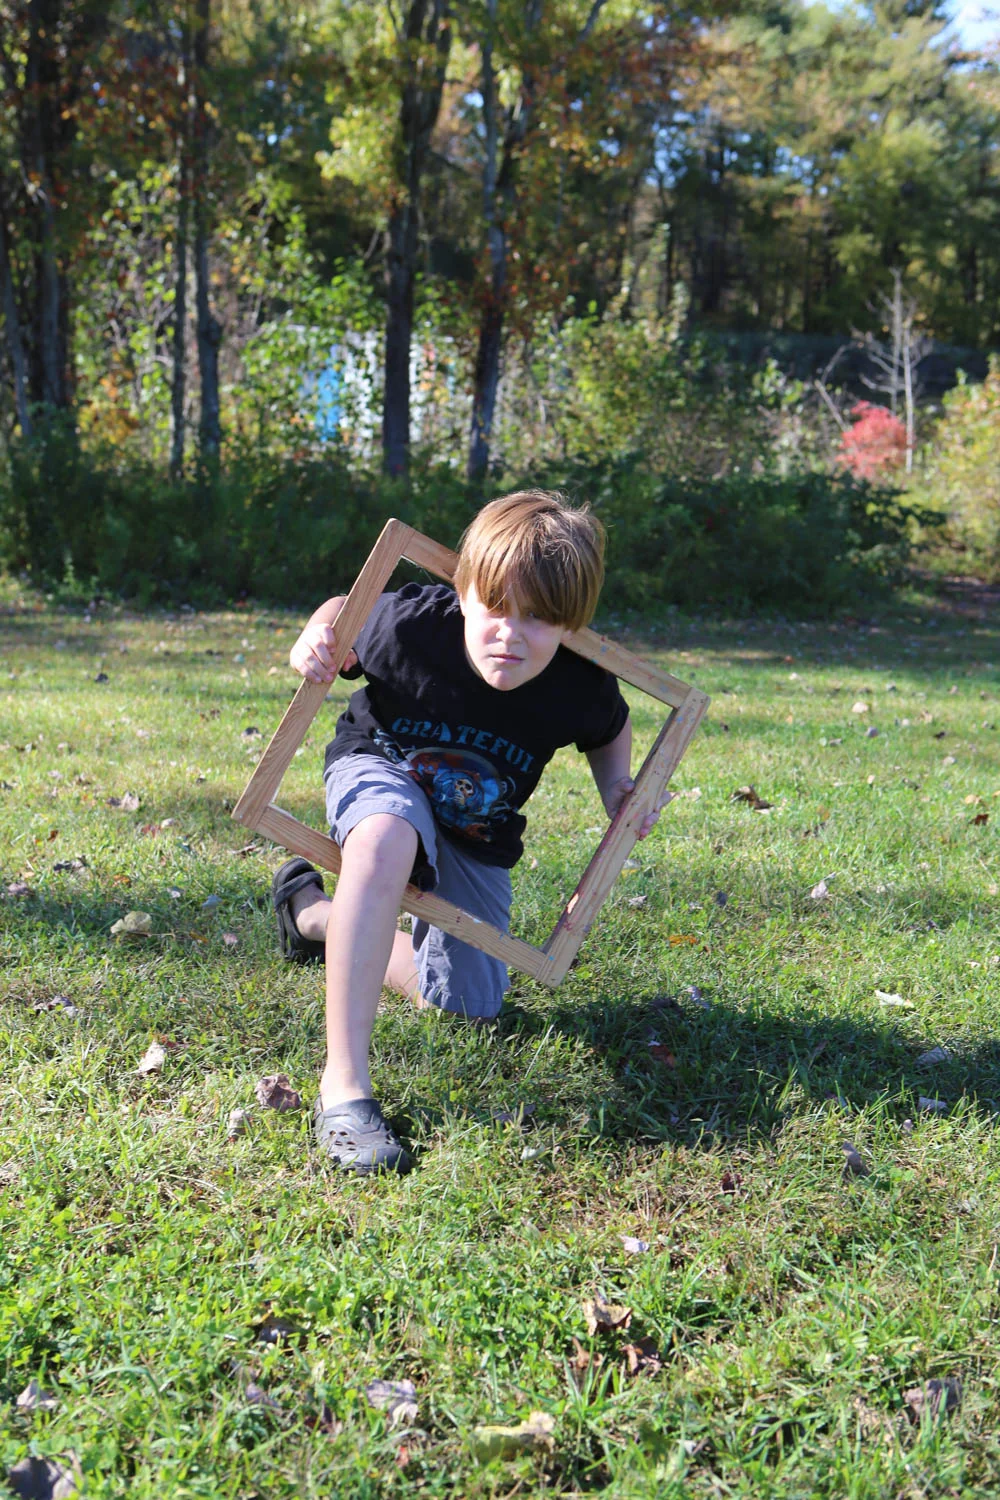
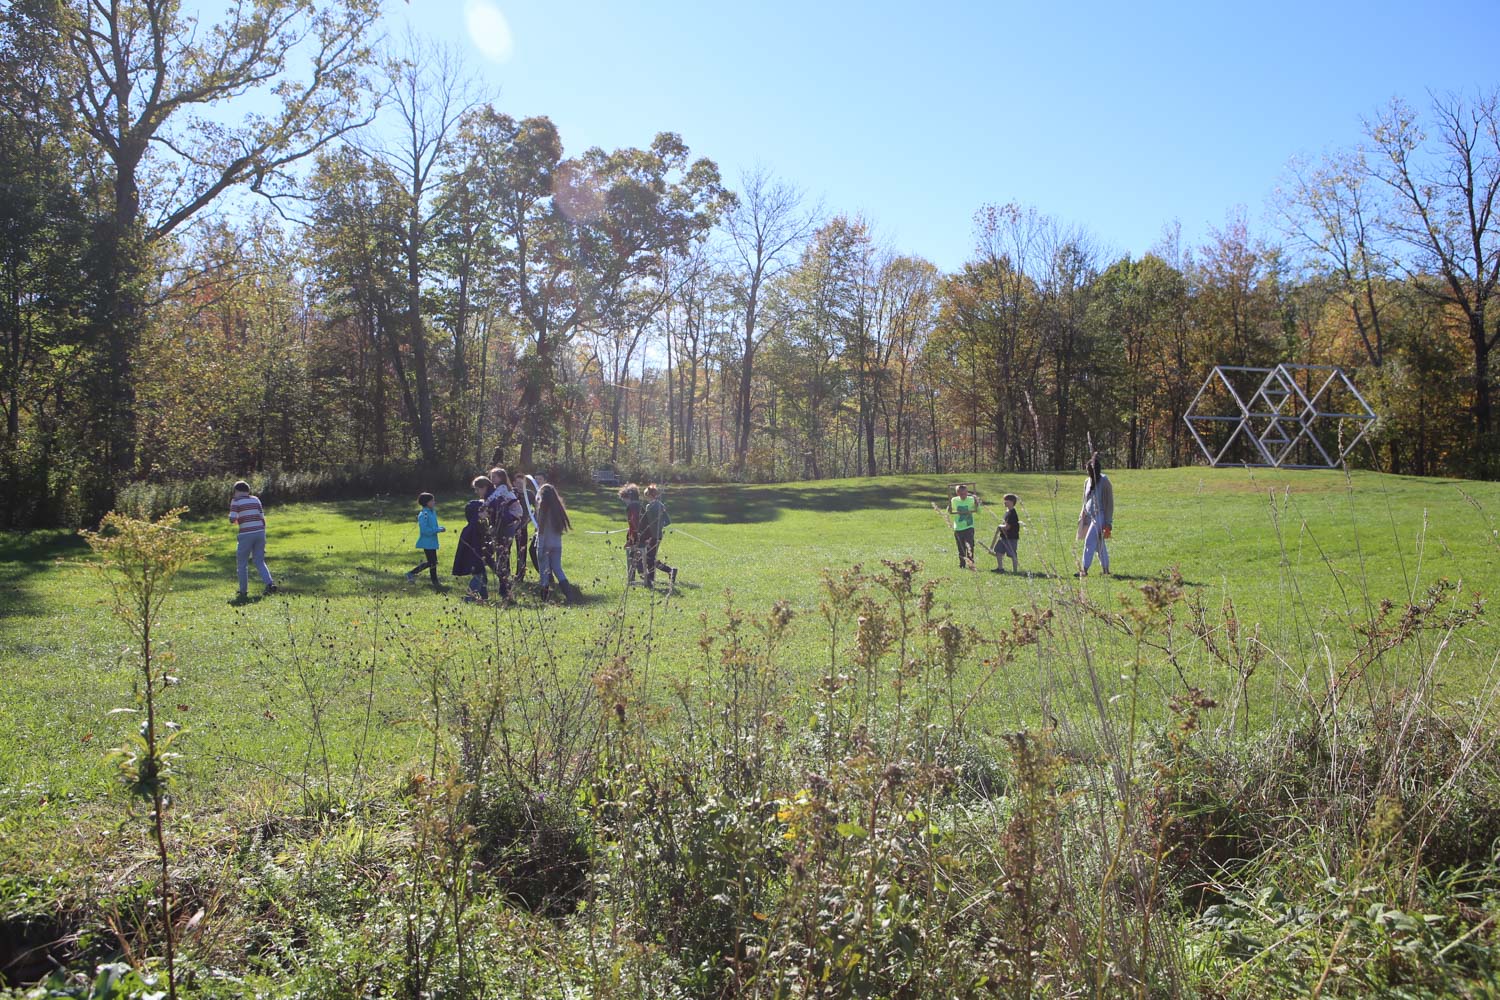
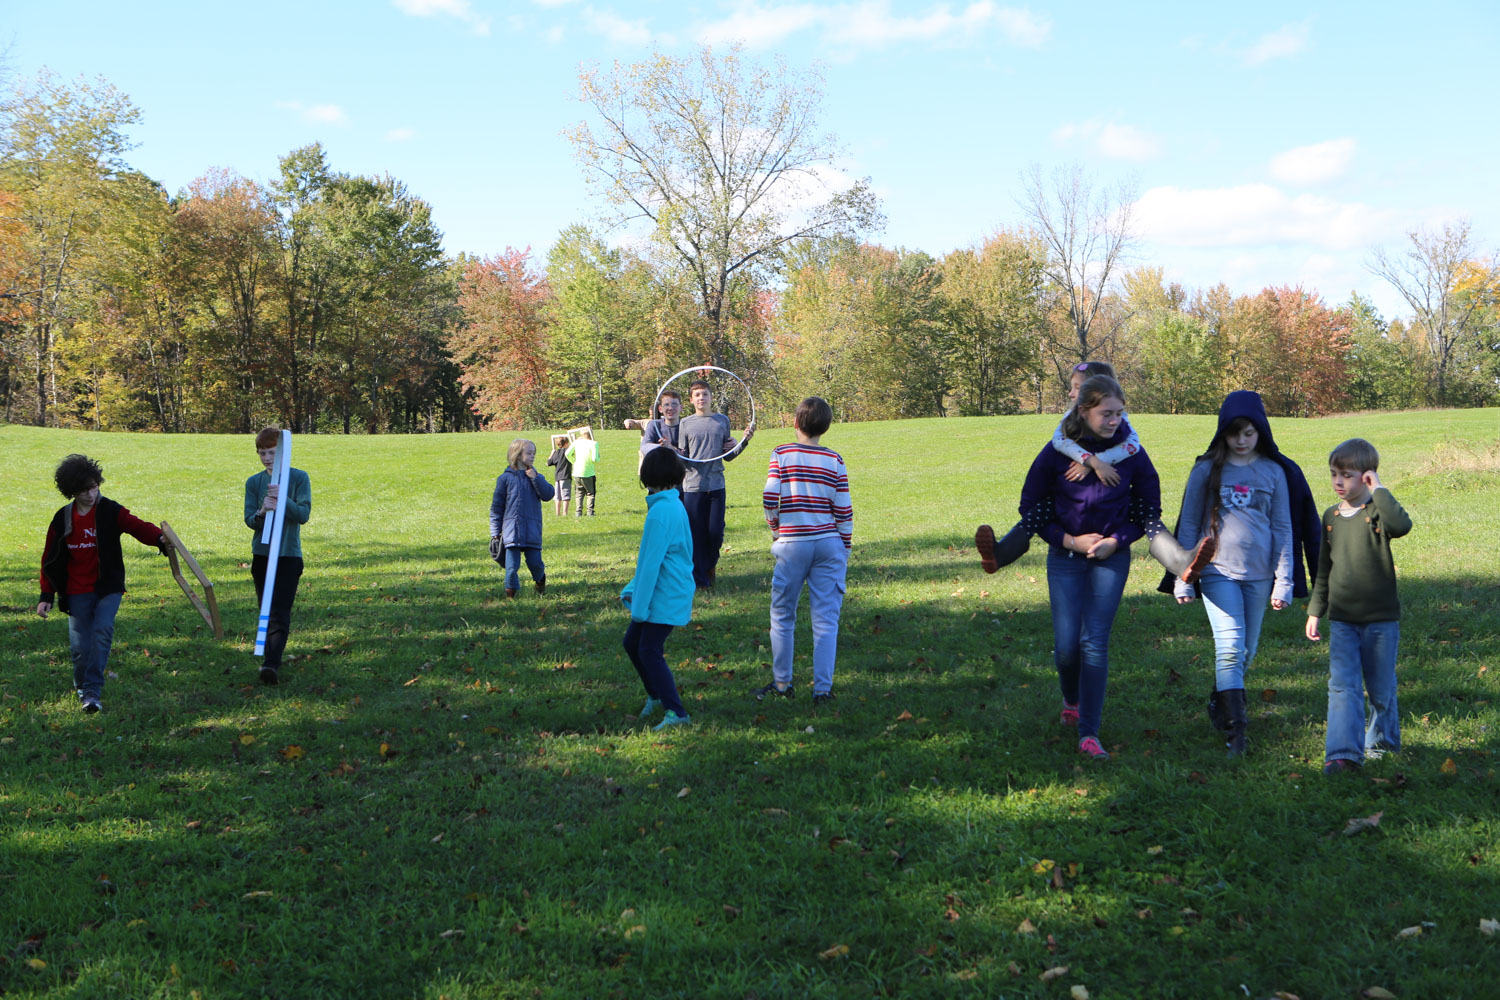
Nature art: We went on a field trip to Art Omi, and explored nature art as a medium for visualizing data. Students were challenged to 1) translate a 2D data visual into a 3D data visual, using collected and found materials, and 2) to use nature art as a medium for visualize a dataset or data story. We learned about consistency and metaphor in data physicalization; and focused on art composition, framing, contrast and repetition.
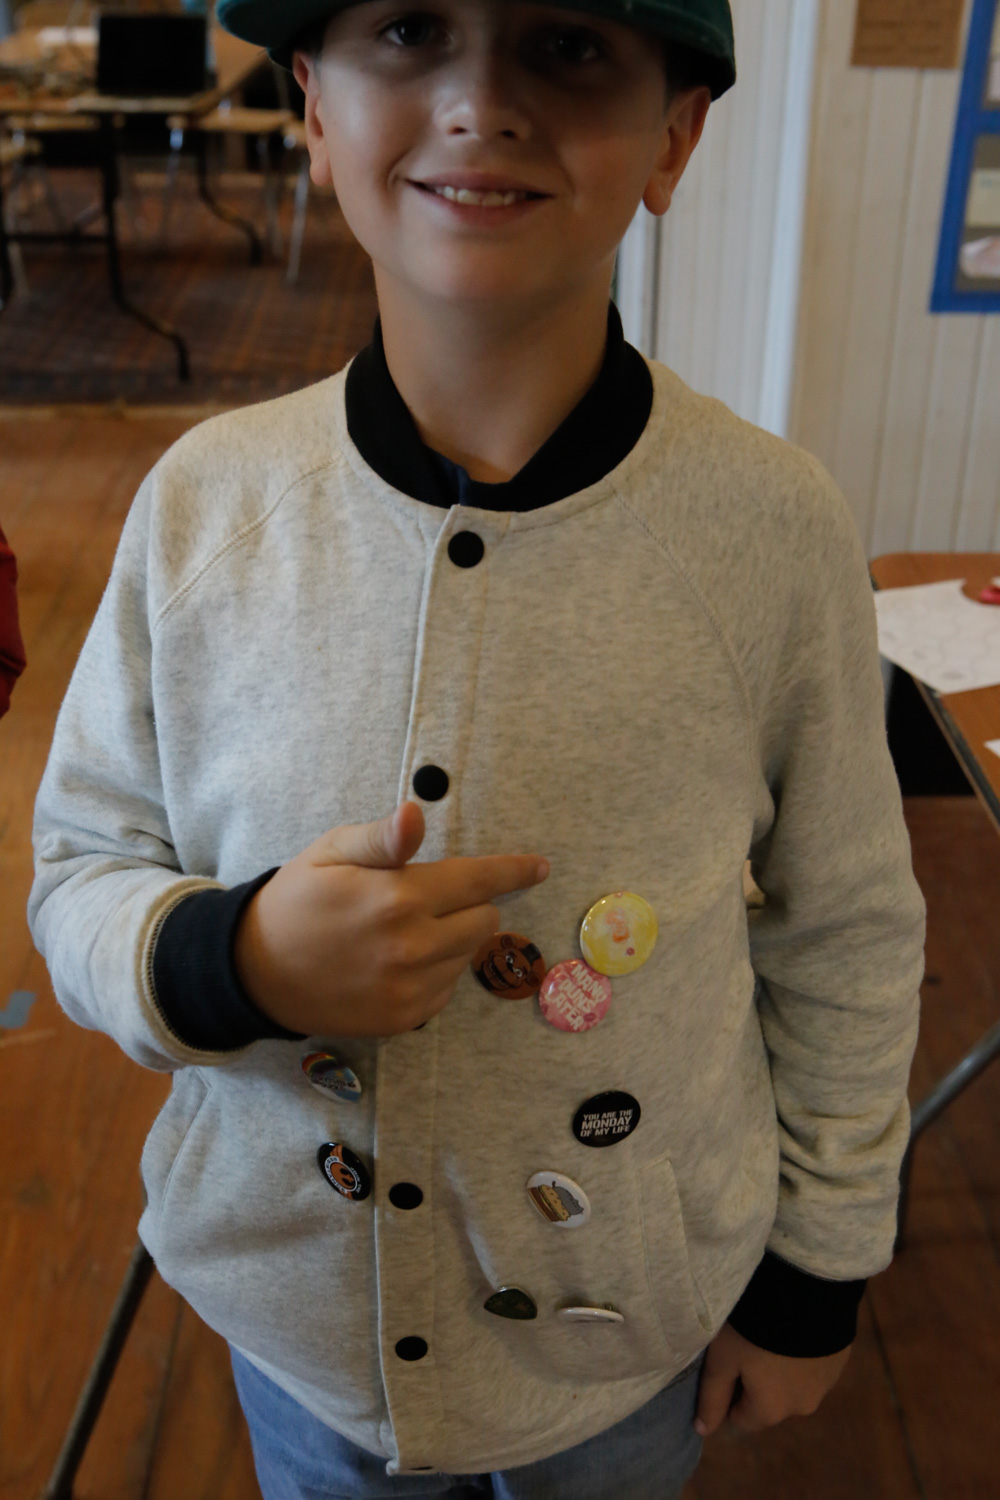
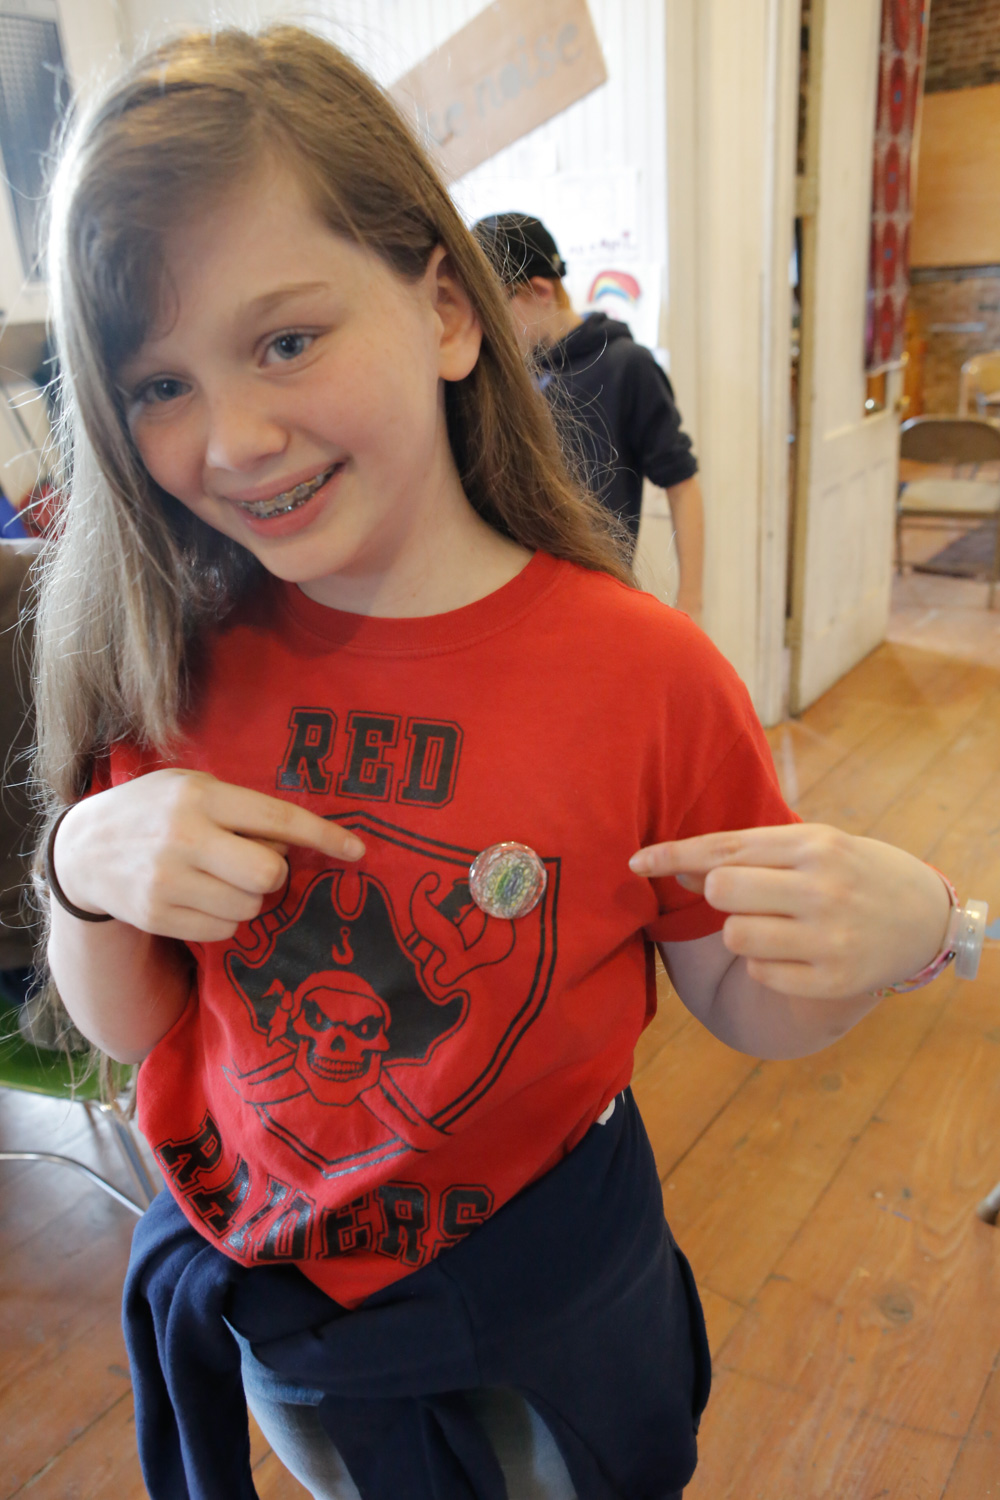
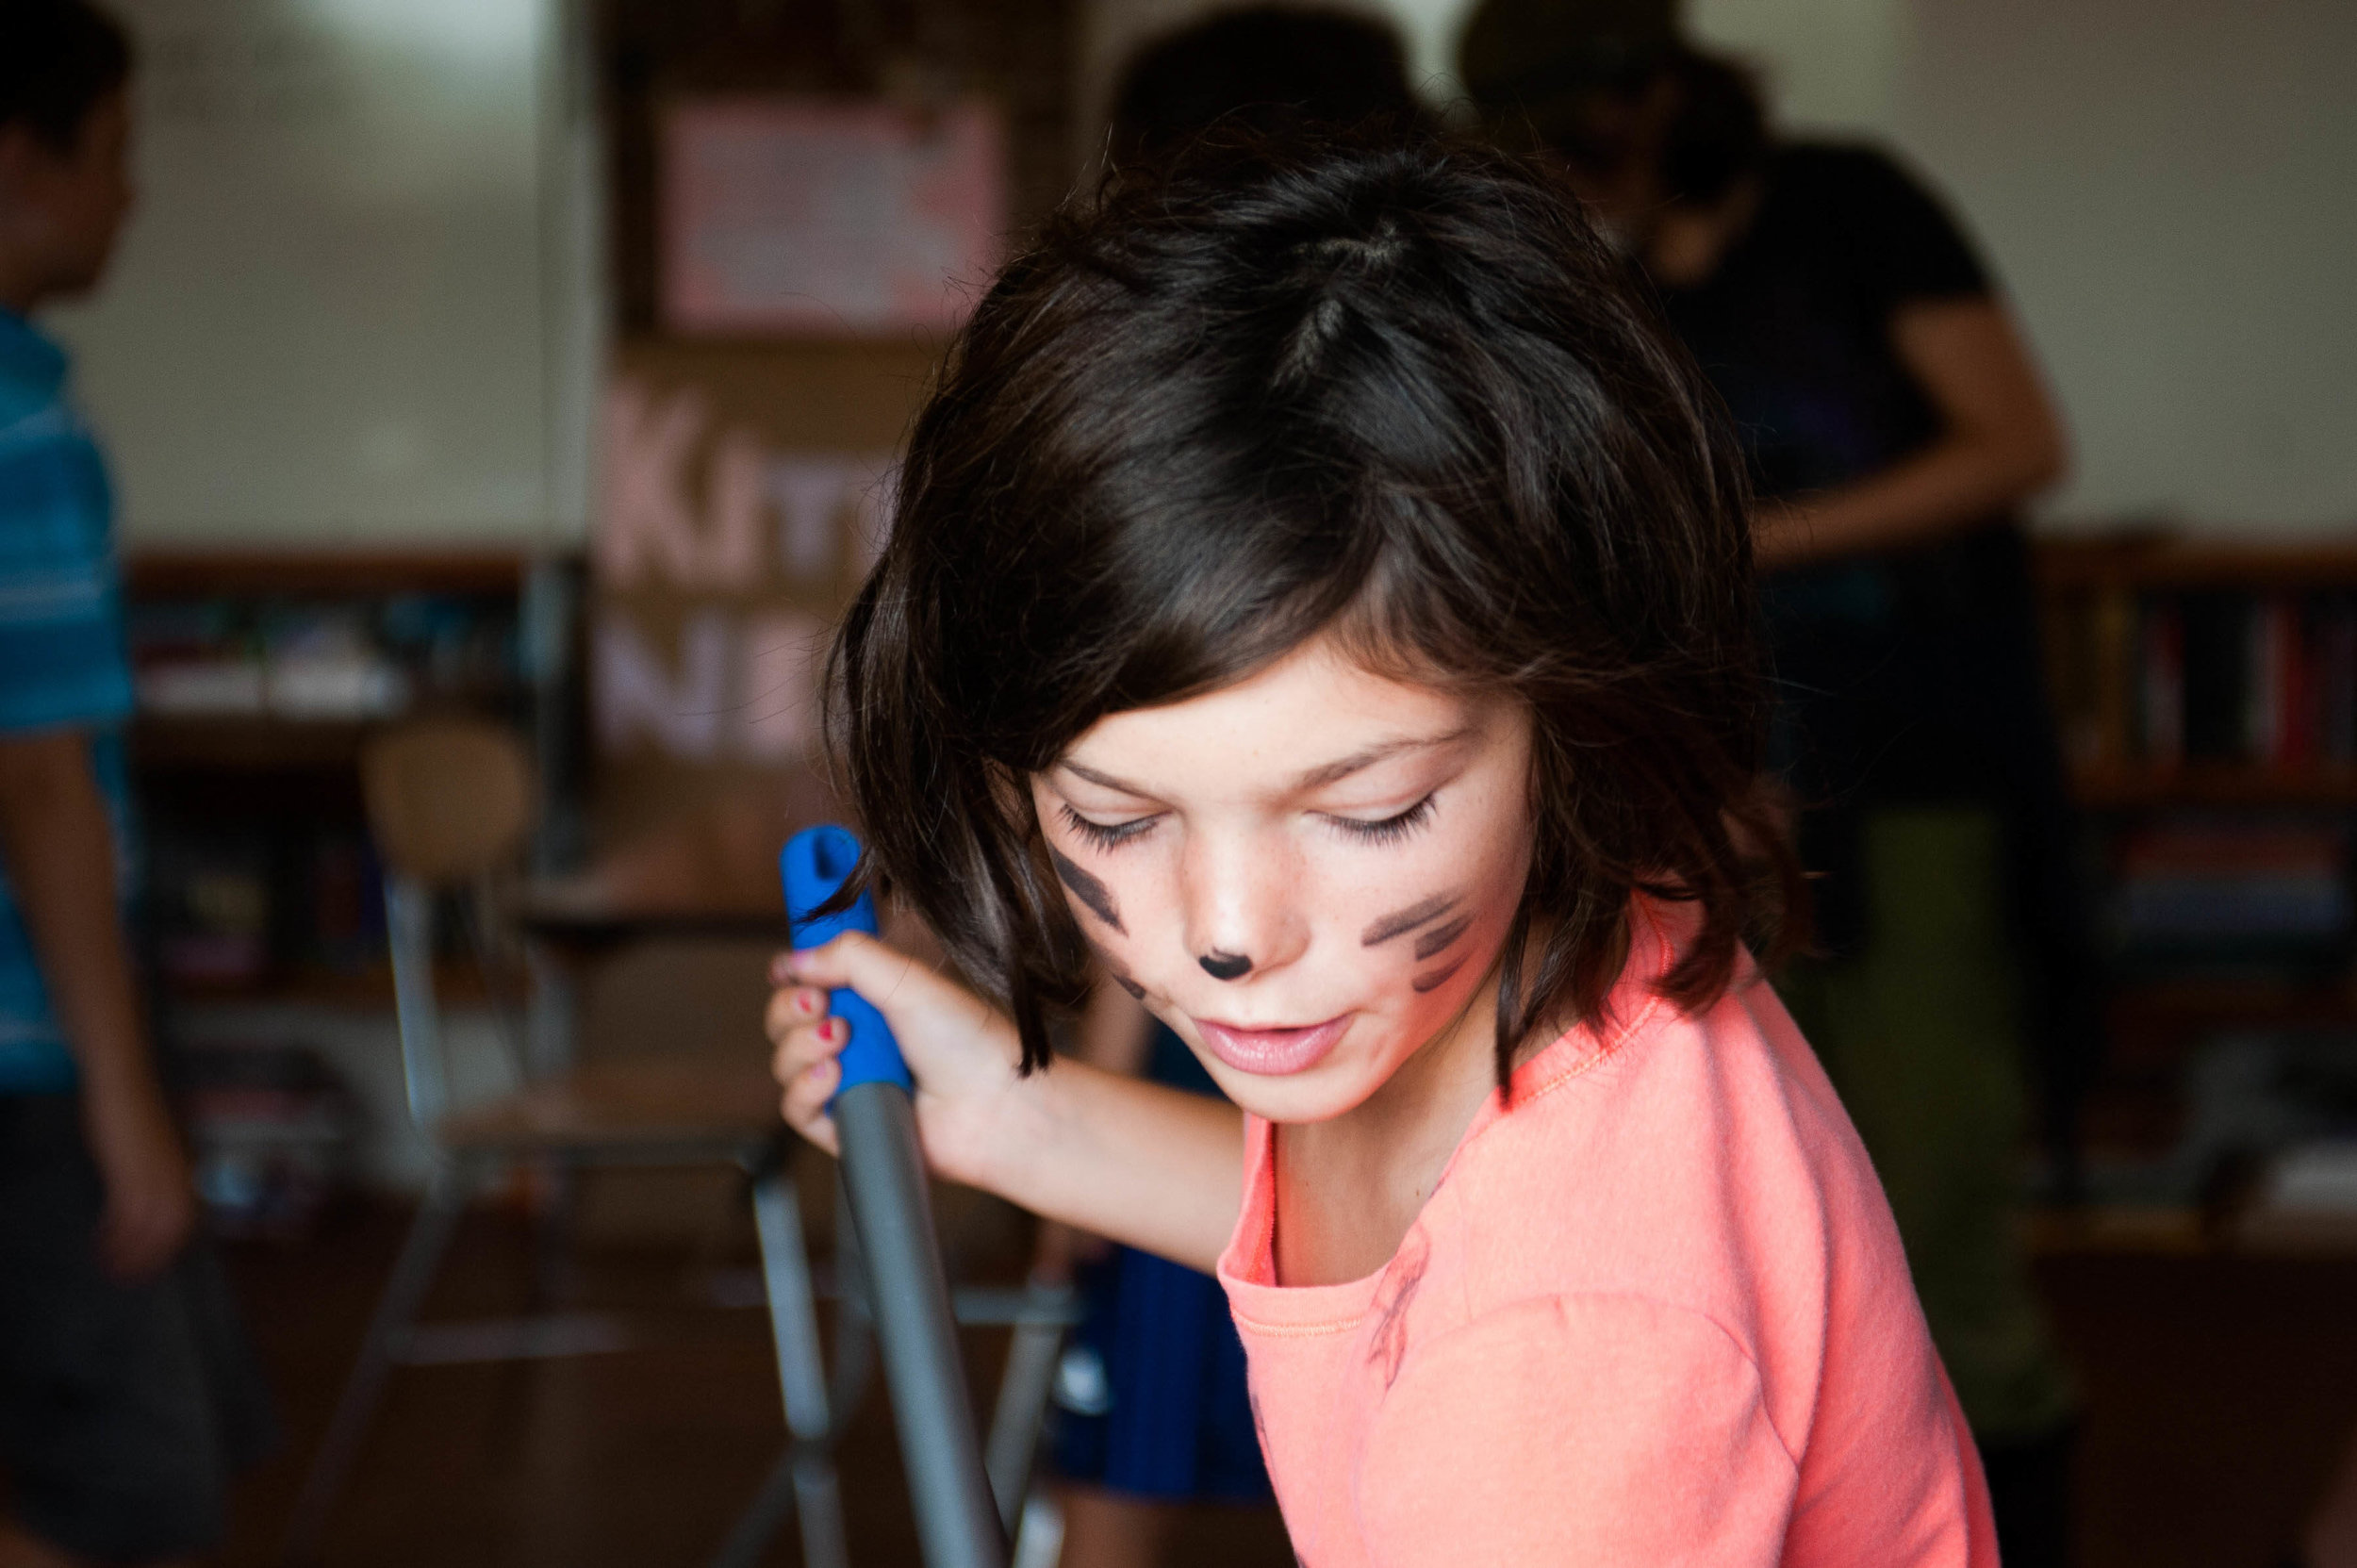
Wearable Art: We explored Wearable Data as a medium for communicating quantiative research, using Homeschooling as a research subject. We gathered data by distributing a survey on the homeschooling experience, and then used our data to create resin rings embedded with a color code that corresponded to each student’s home school experience. The survey included questions around sleep habits, socialization, hours spent studying, hours spent playing (and a conversation about whether there’s a difference!) (Note: the teachers also took the survey, and learned that we’re only average 1 hour a week of play - booo!) Students were then asked to collect qualitative data about their homeschooling experience, creating DIY “tiny books”. As part of our wearable data theme, we created button with our individual data names, which we created by running our “old names” through a flow chart. For example: one student’s name was “Venerable Guardian of the Pie Chart”. Another is “Magical Advocate of the Venn Diagram”.
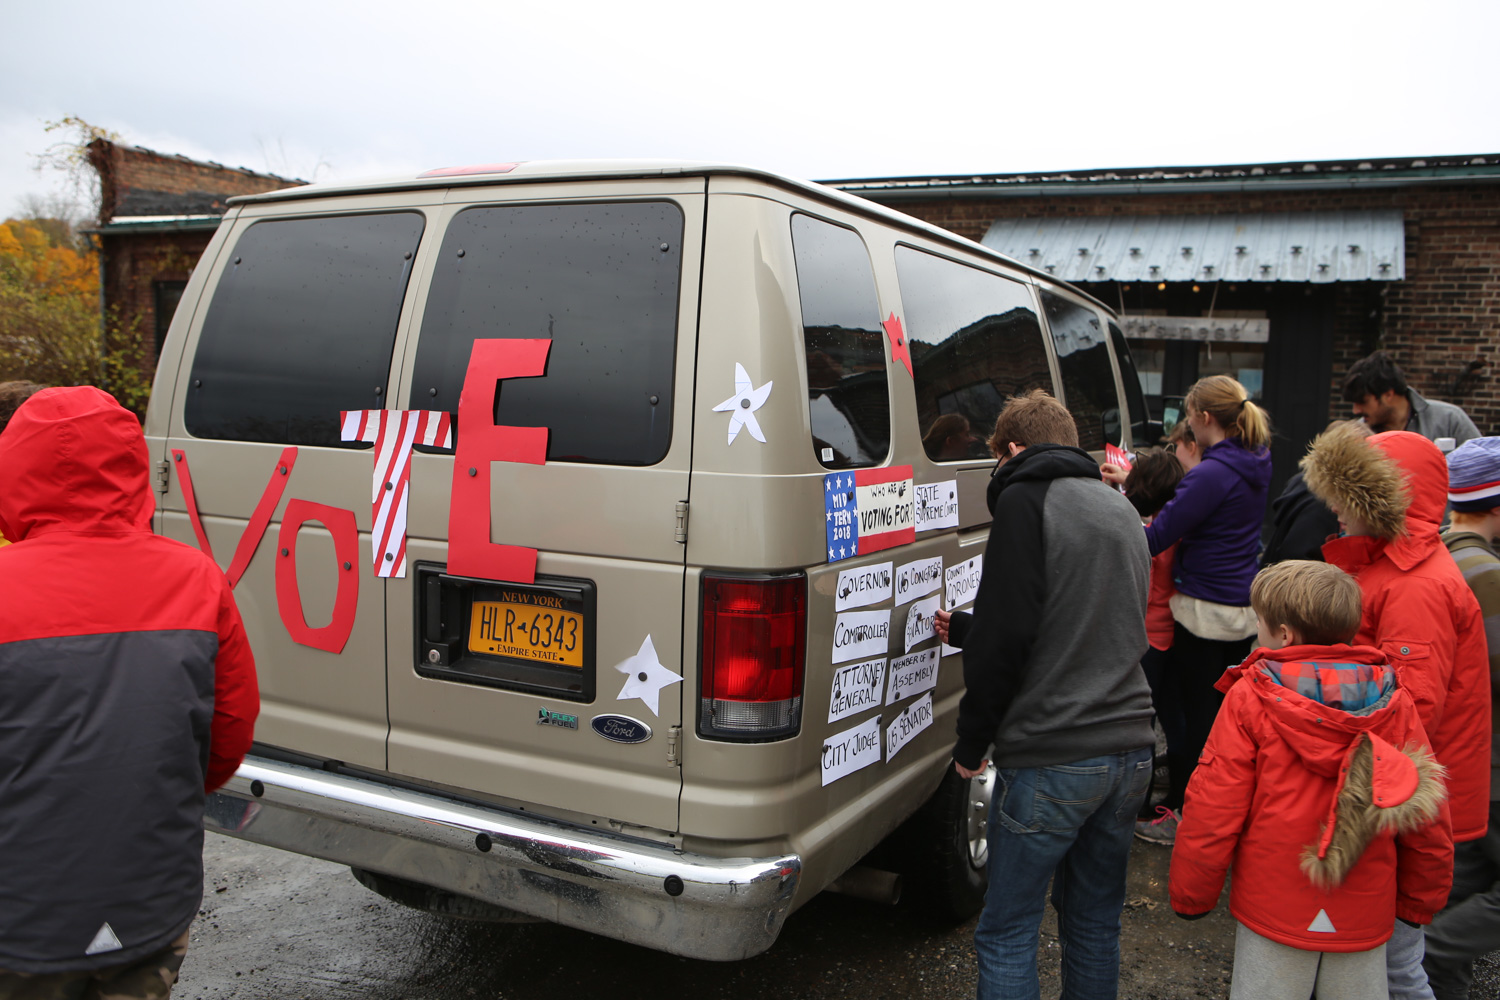
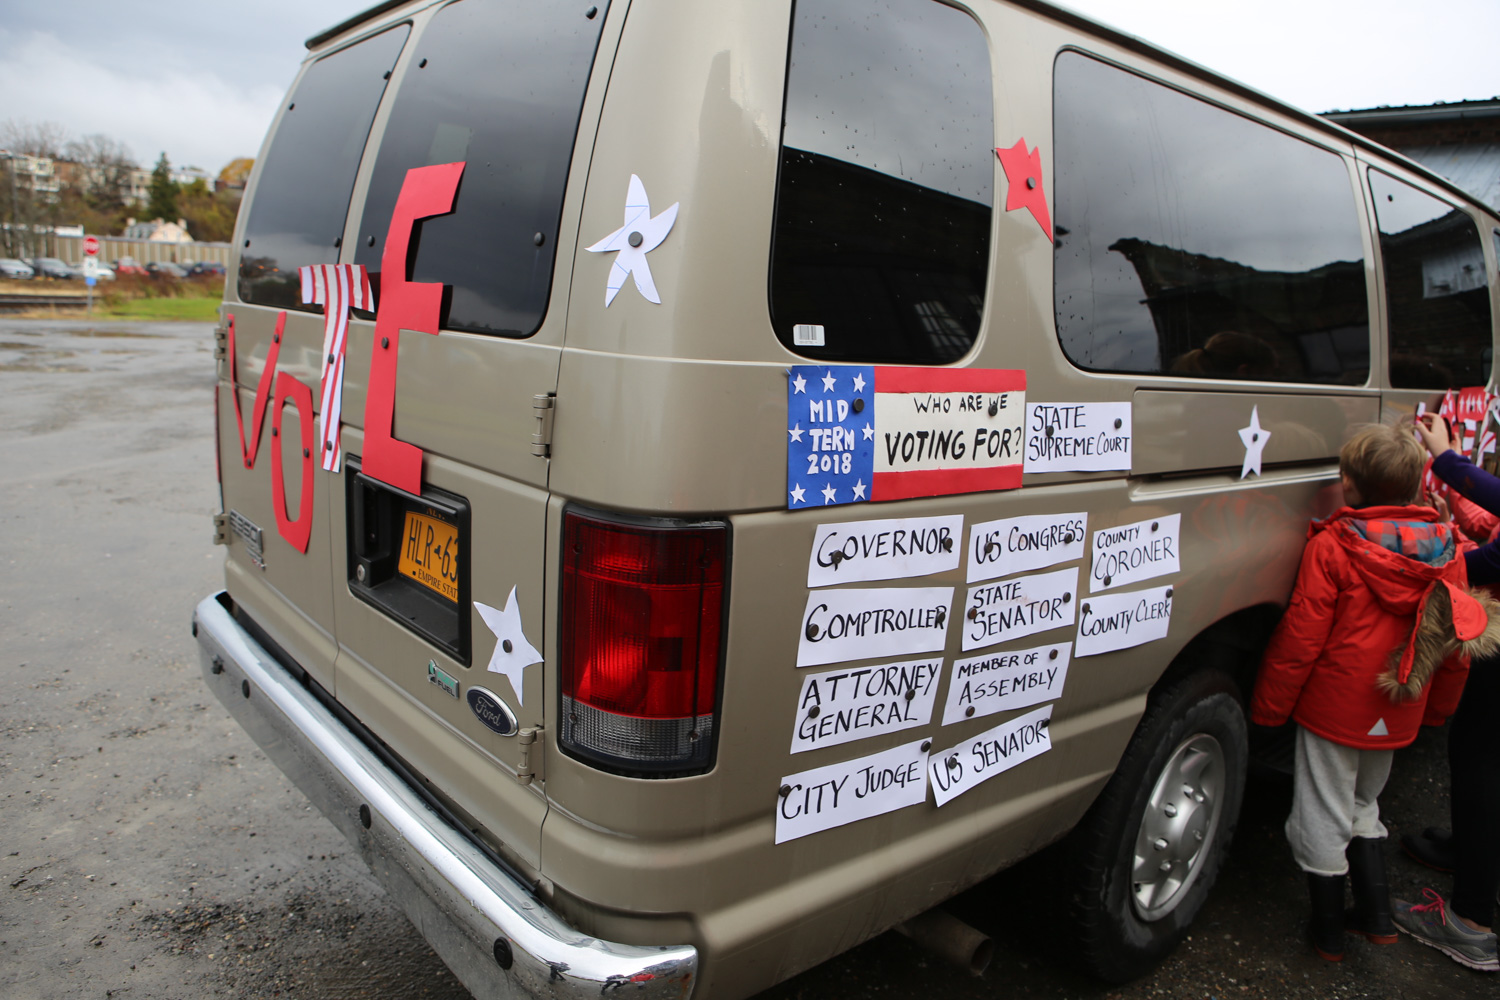
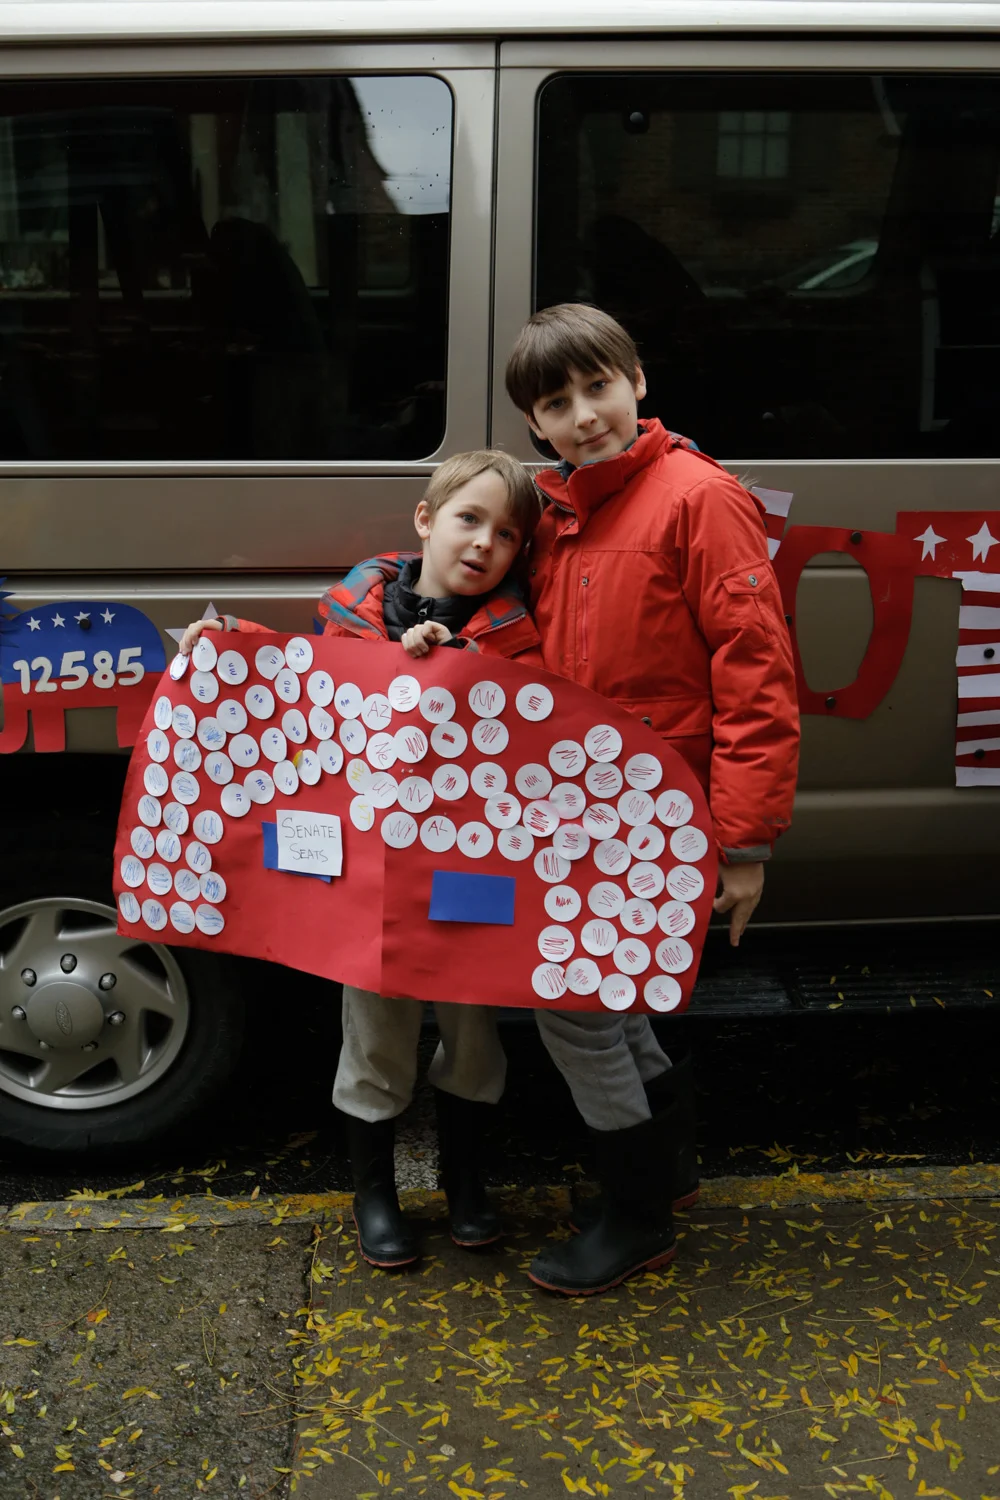
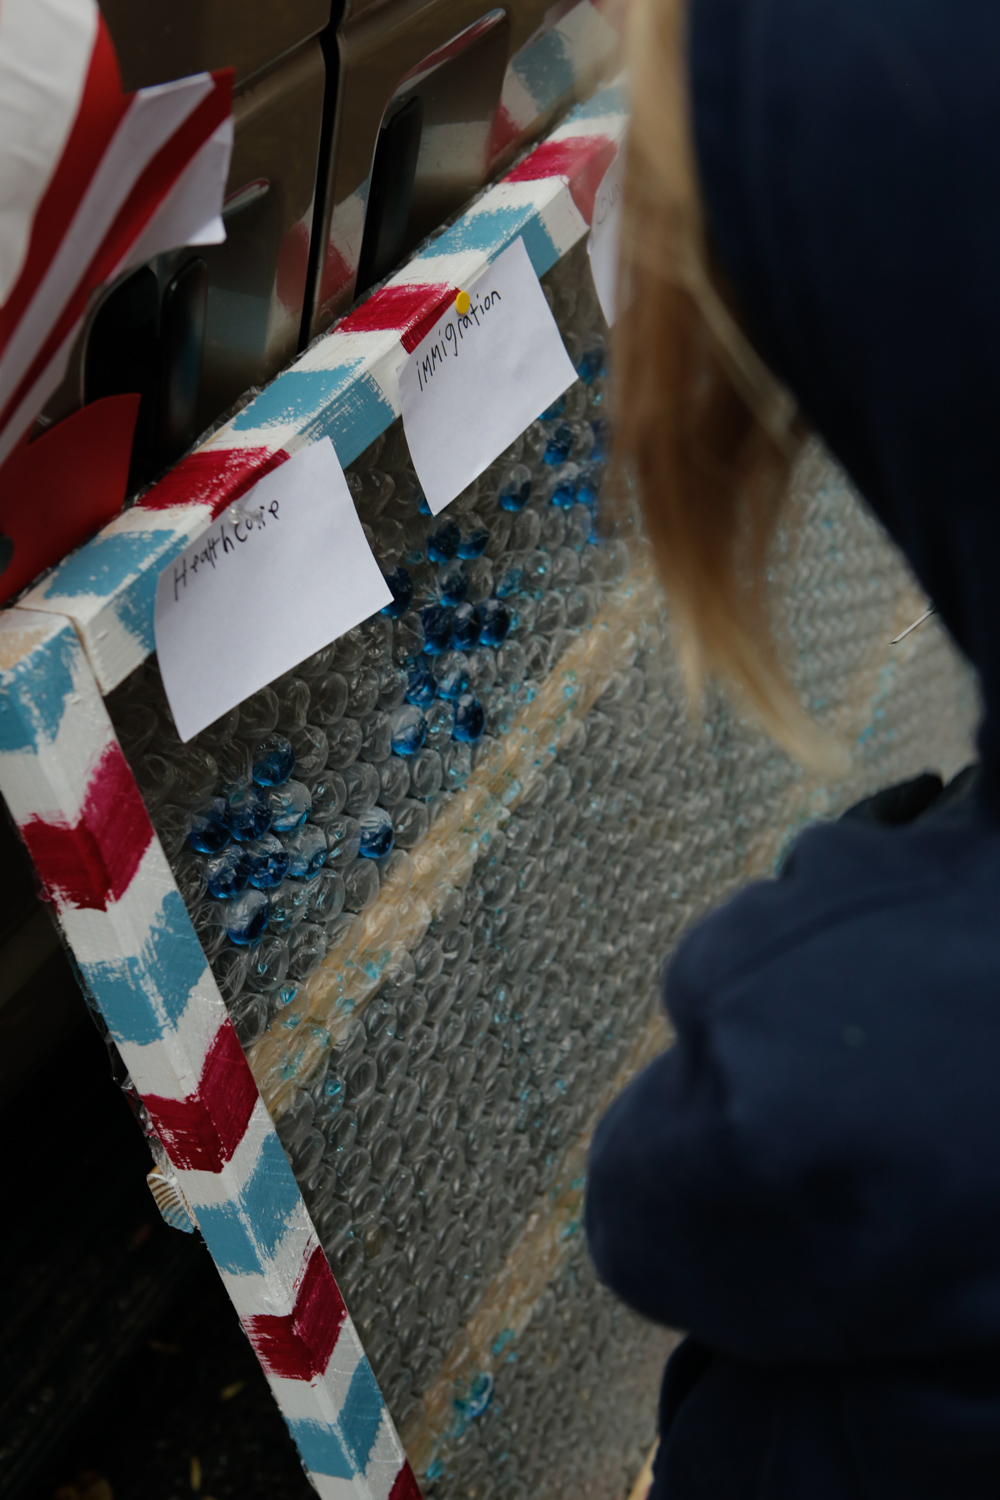
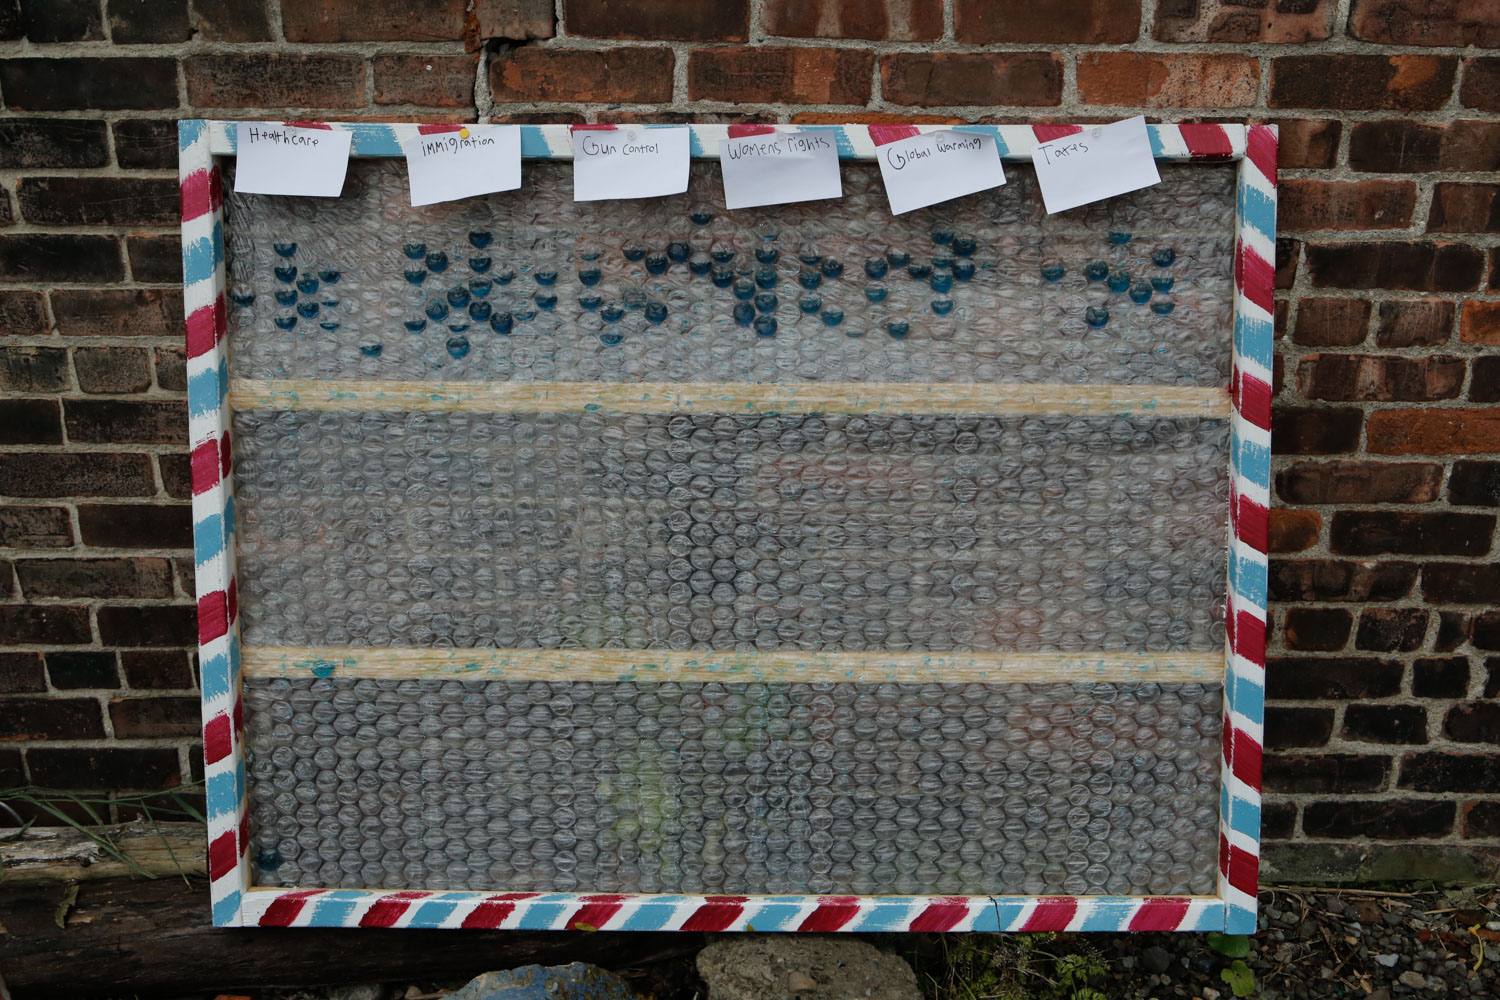
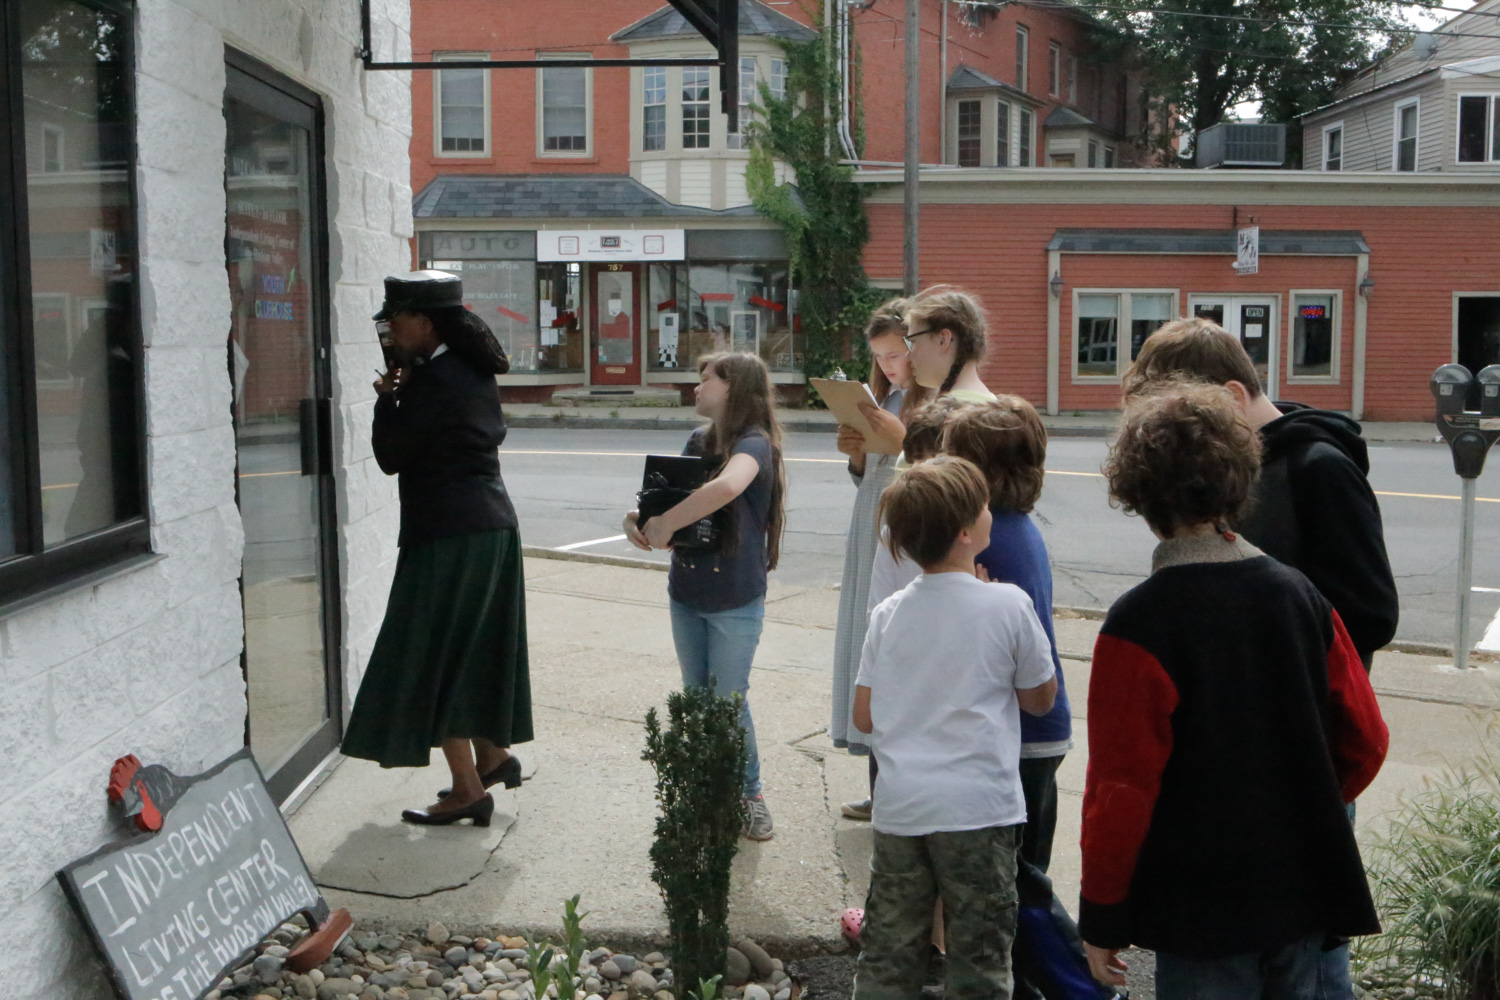
Current Events: Part-way through class, we turned our attention to the upcoming midterm elections. We headed to the Hudson Area Library to conduct research, on topics like: Voter Rights and Supression, the 2020 U.S. Census, Gun Control Policy, and Immigration Policy. Students created infographics to share their learnings with the class. In studying current events, we practiced engaging with statistics -- like in a 2018 IPCC report on climate change, and a table on election results. On election day, we learned about how voting districts are created in the U.S., playing the “Gerrymandering Game” to look at the power of mapmaking within the current electoral system. Then we transformed the Kite’s Nest van into a vote-mobile, and hit the streets to collect data. With our “high tech” bubble wrap data collector, we asked voters on the streets about what brought them to the polls, visualizing our data in real time. Some top answers we heard: #immigration, #womensrights, #globalwarming, and #guncontrol.
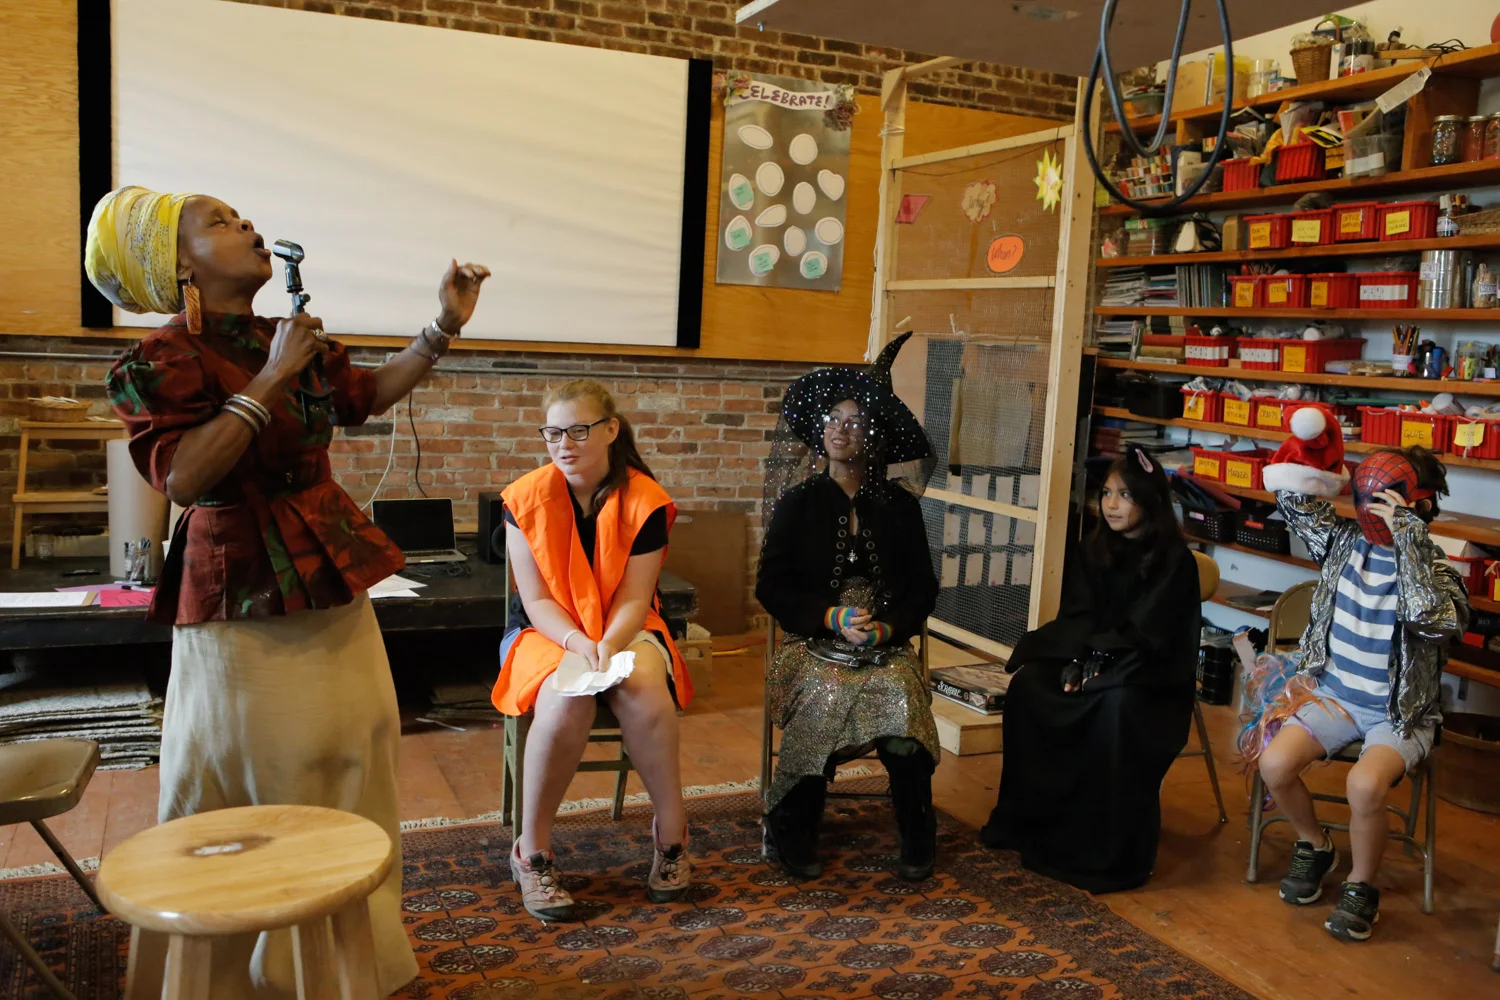
Living Museum: Students were assigned three different historical moments in which data collection, analysis and visualization had a revolutionary effect on society. Topics were: 1) Mapping of cholera outbreaks in Europe and the revelation of the existence of microscopic organisms, 2) Florence Nightingale and her observation of death toll rates during the Crimean war due to unsanitary conditions of wounded troops, and 3) “the Million Dollar block” crisis related to the over-policing of poor and disenfranchised communities. In groups, students created a LIVING MUSEUM, acting out the details of our research as a way to teach back to our fellow students. Together we created a DIY Visual Vocalizer contraption using infrared lights, balloons, and PVC pipes as a way of visualizing our emotions.
Final Projects
Our final three weeks of class were devoted to individual and small group projects, led by driving questions like: What does the tooth fairy do with all the teeth she collects? What can magic tricks show us about how memory and sight work? If we were to design a new Kite’s Nest building, what would we want it to be? How can we redesign immigration policy in the U.S.? What elements are the planets in our atmosphere made of and how are they similar / different from earth? With these driving questions, students designed surveys, collected data, analyzed data sets to uncover patterns, researched supportive documents, and designed both 2D and 3D visuals of their data stories.
Learnings/reflections: One of the challenges in teaching what is best described as a “math class” to students ranging in age and math comfortability is creating a learning environment that is engaging, gratifying, and equitable. We identified from our first class the need to have activities that can be performed by small groups, large groups, or individual students, in order to provide options for students in how they want to learn, while creating a community that supports each other. Early on in the semester, we also had one-on-one meetings with students to learn more about each student’s previous experience in math, and to set learning goals for the future. These learning goals were framed to be both academic and personal. These meetings were an opportunity to support students and teachers in finding connections between class content and student interests. We also introduced classroom jobs for students, ranging from “Morning Meeting Leader” to “Class Calculator”; these roles cycled throughout the semester, providing opportunities for leadership and responsibility. This system allowed student leaders to help decide how we start and end our day, to help record class data, and to be point people for calculator help or tech support.


EN FRANÇAIS
Thursdays, 9:30am - 3:00pm | Ages 8 - 14 | September - December 2019
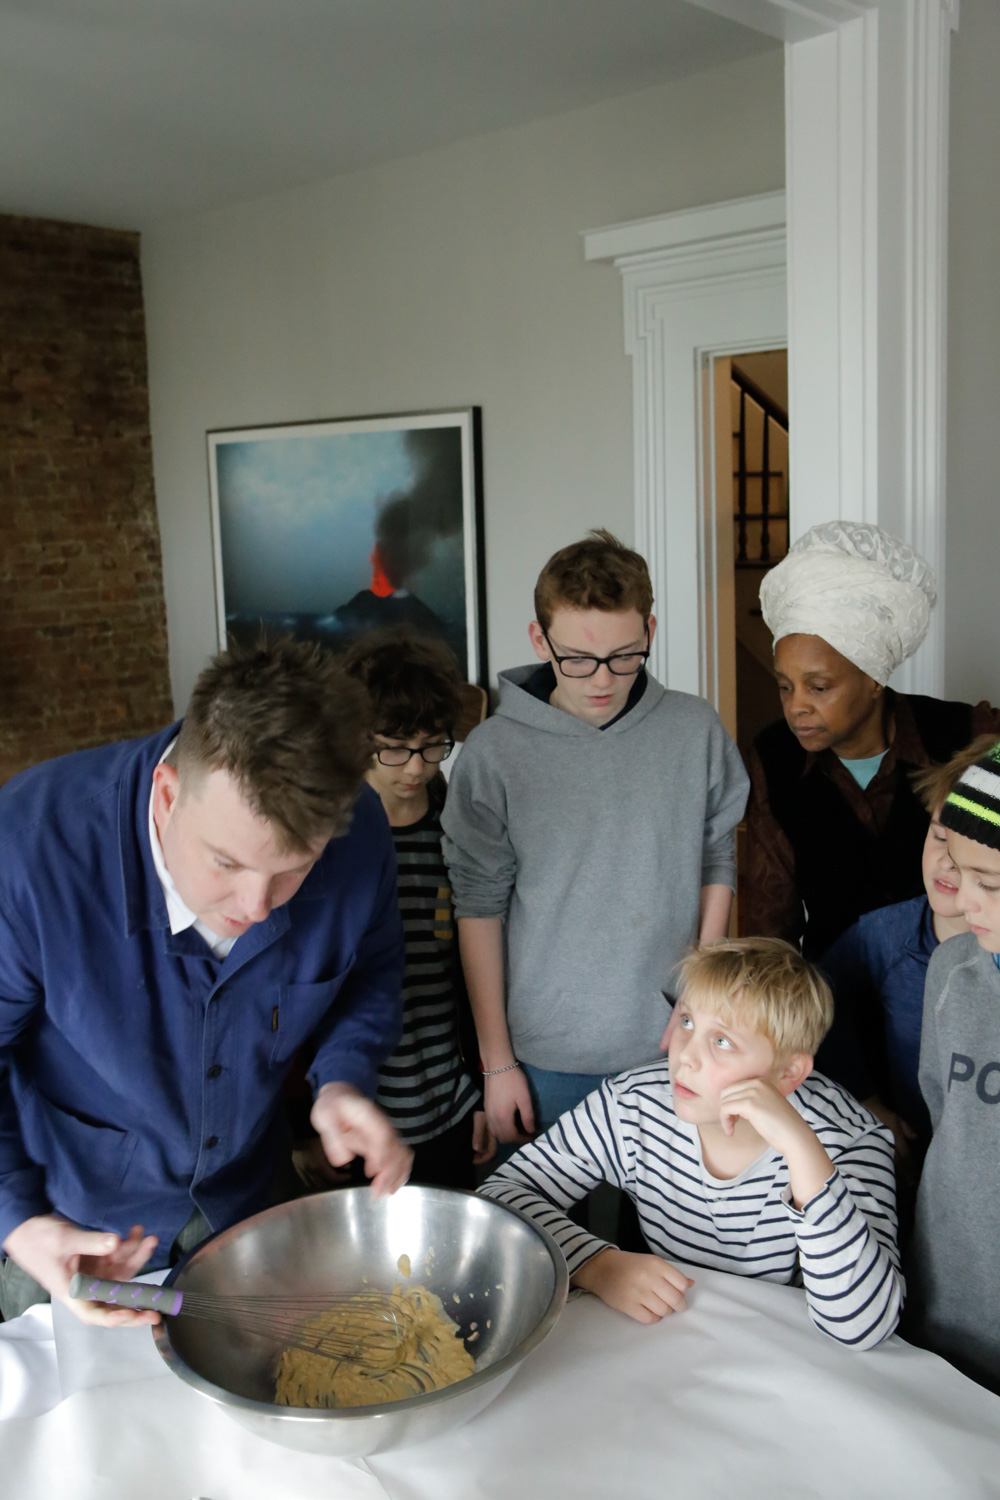
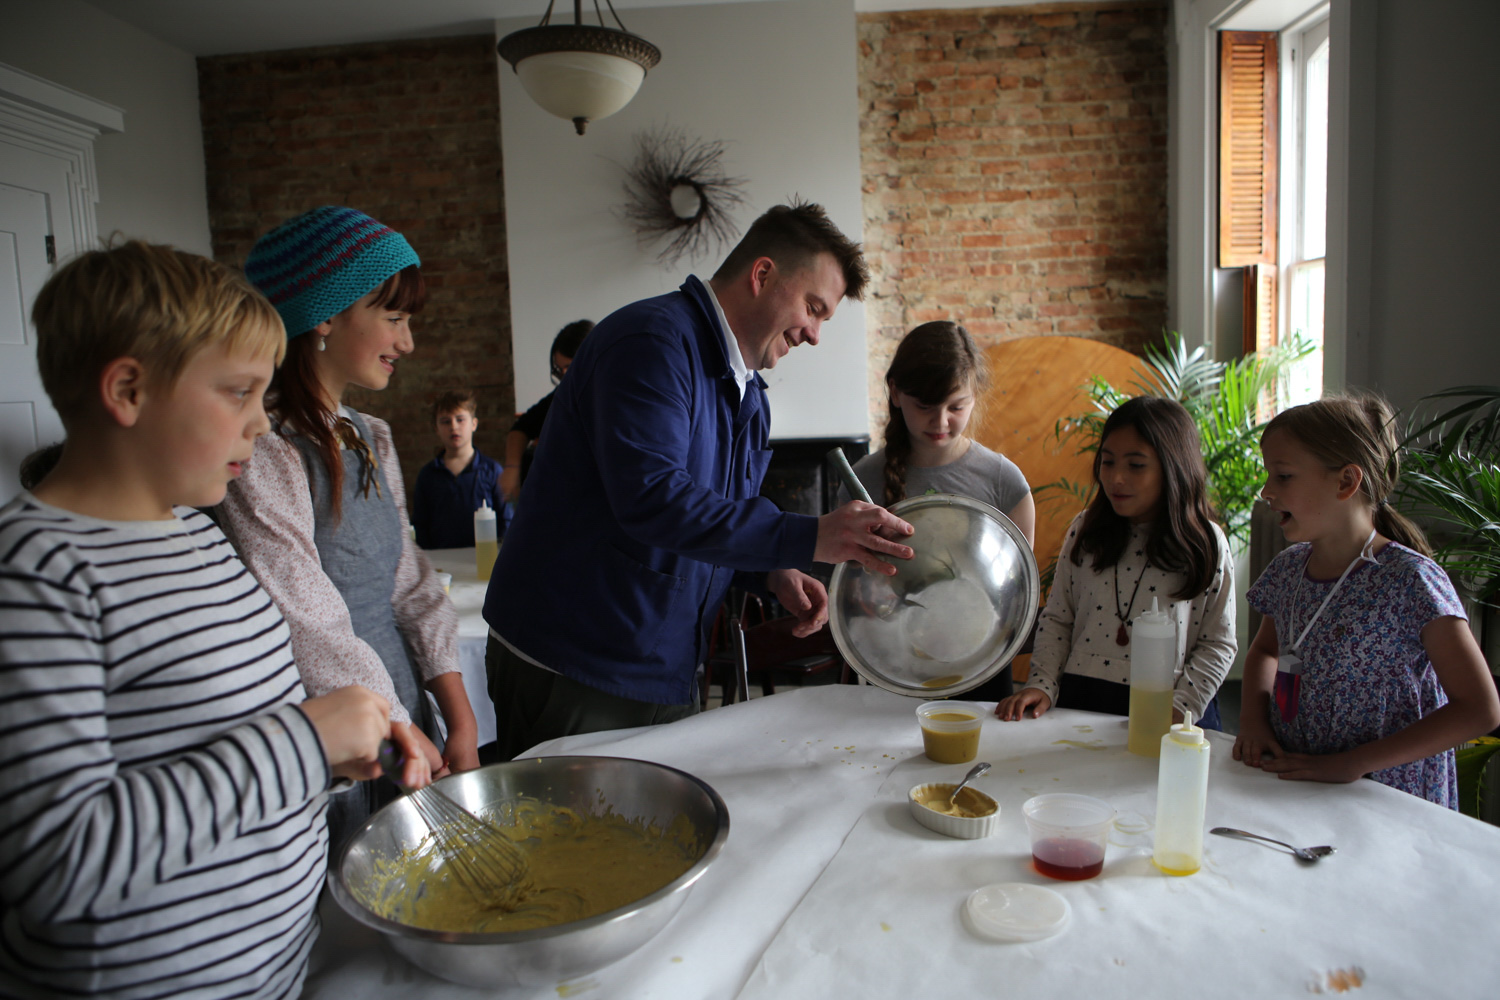
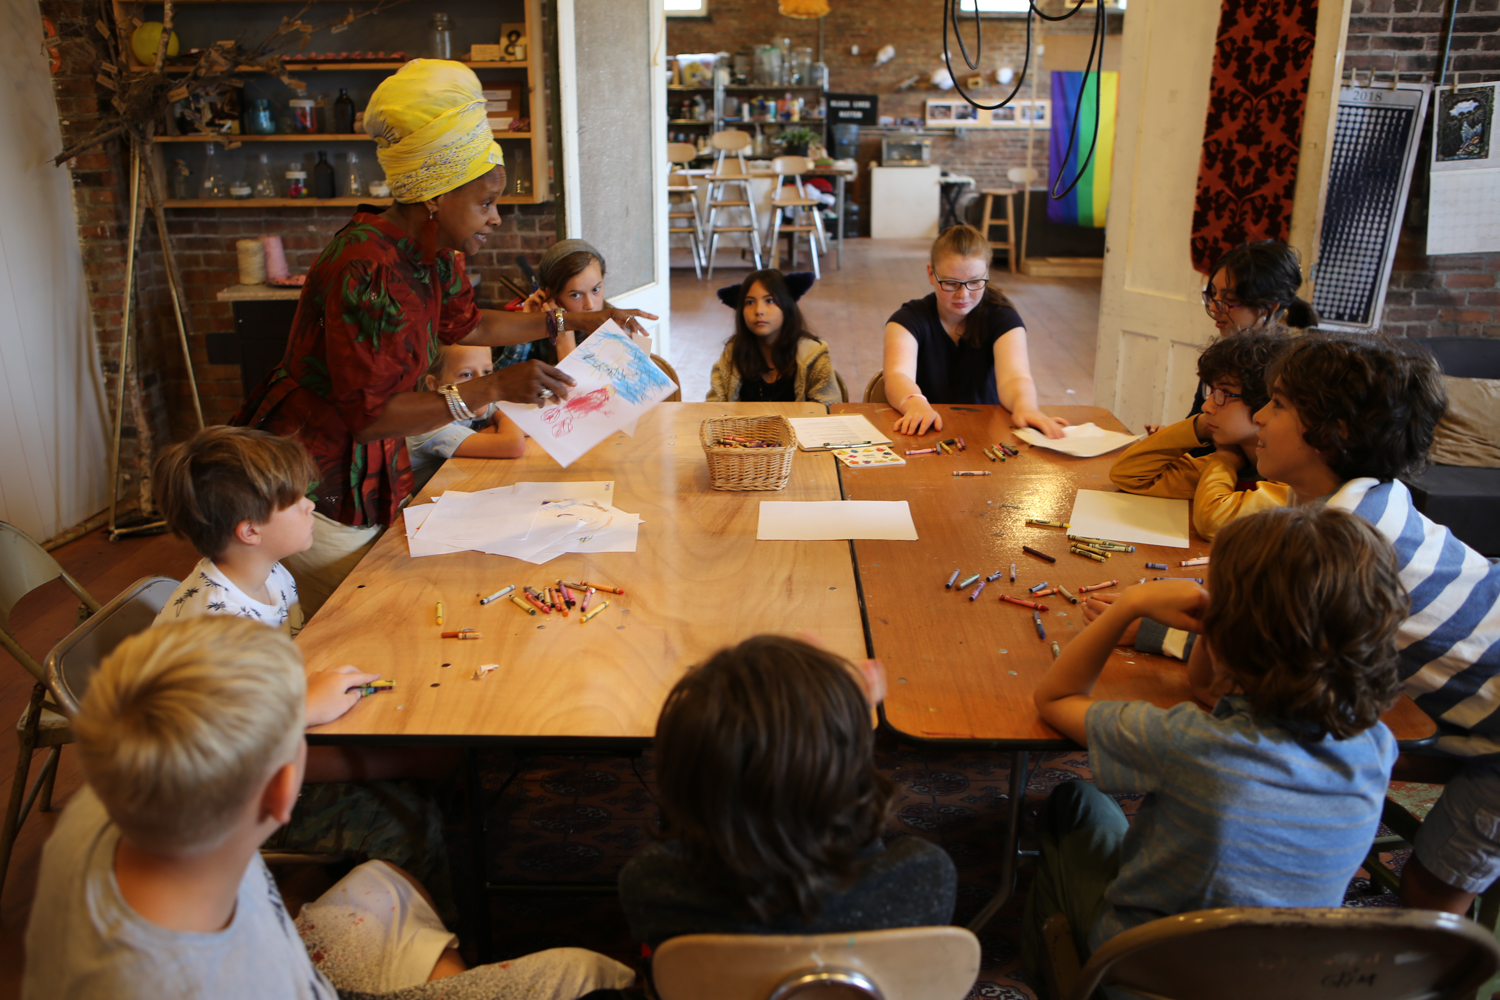
Creative and interactive French immersion. With Pamela Badila and Zebi Williams.
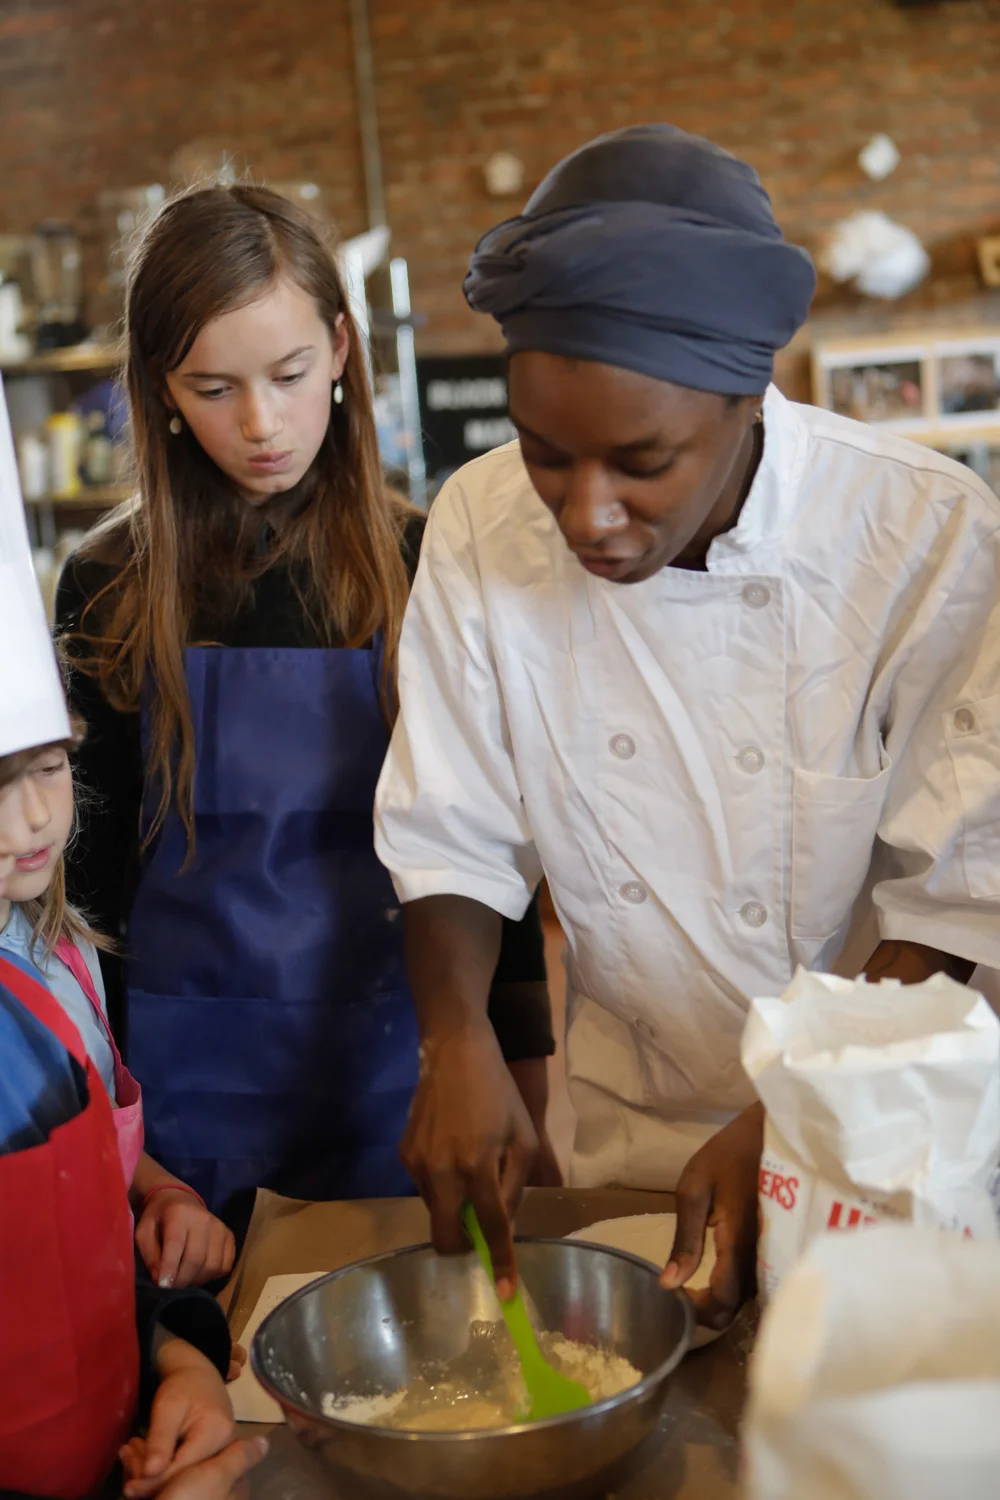
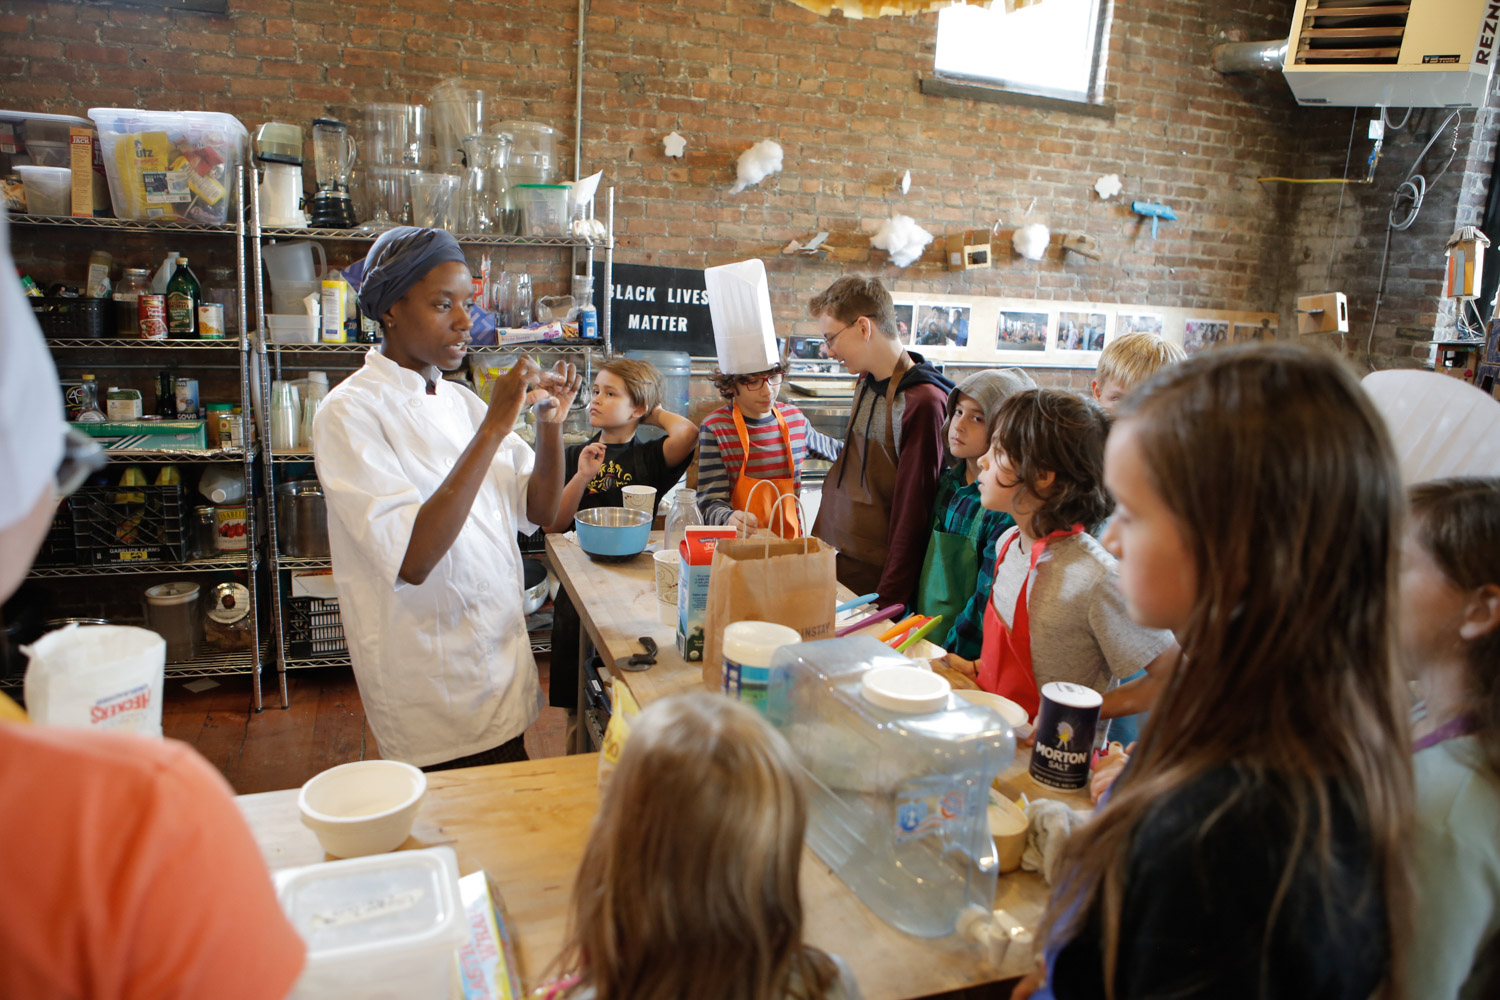
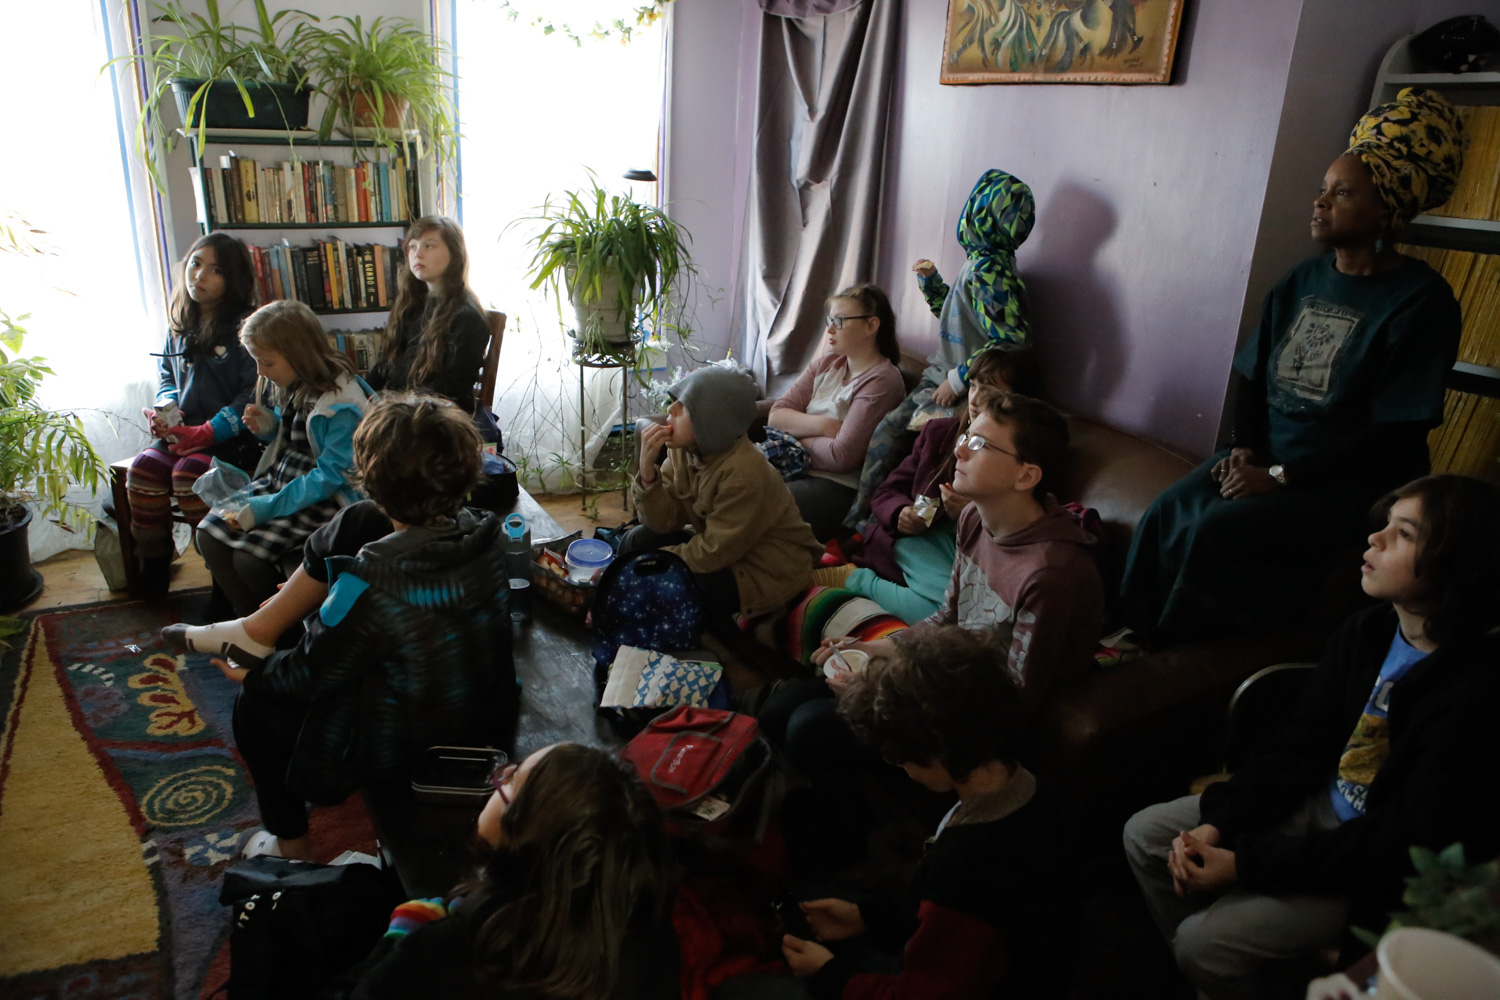
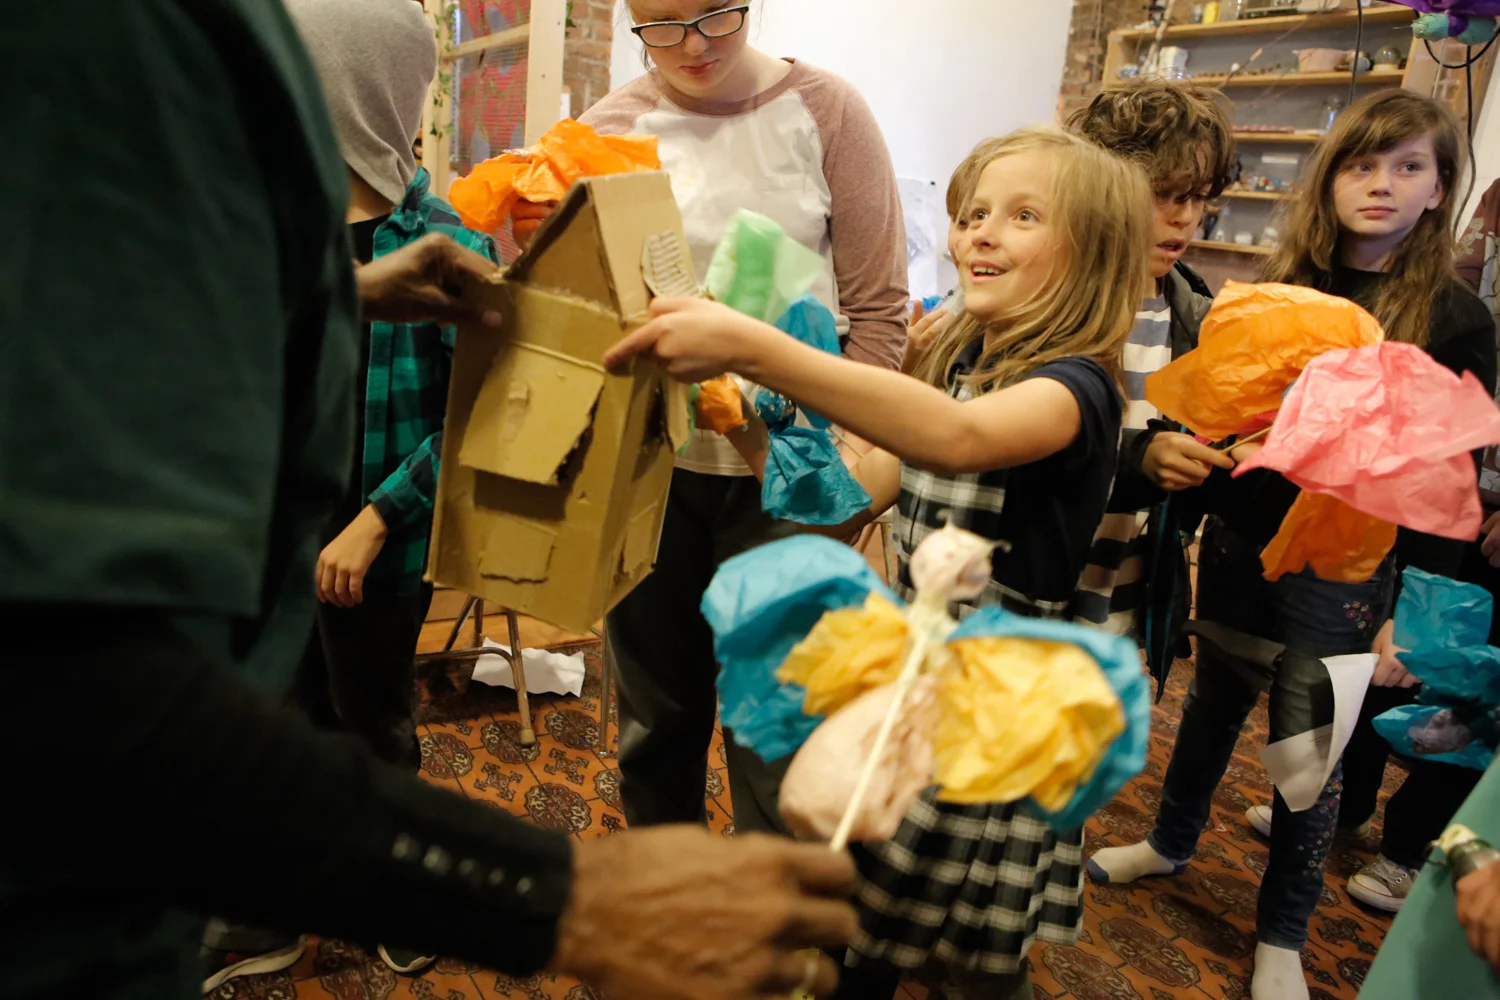
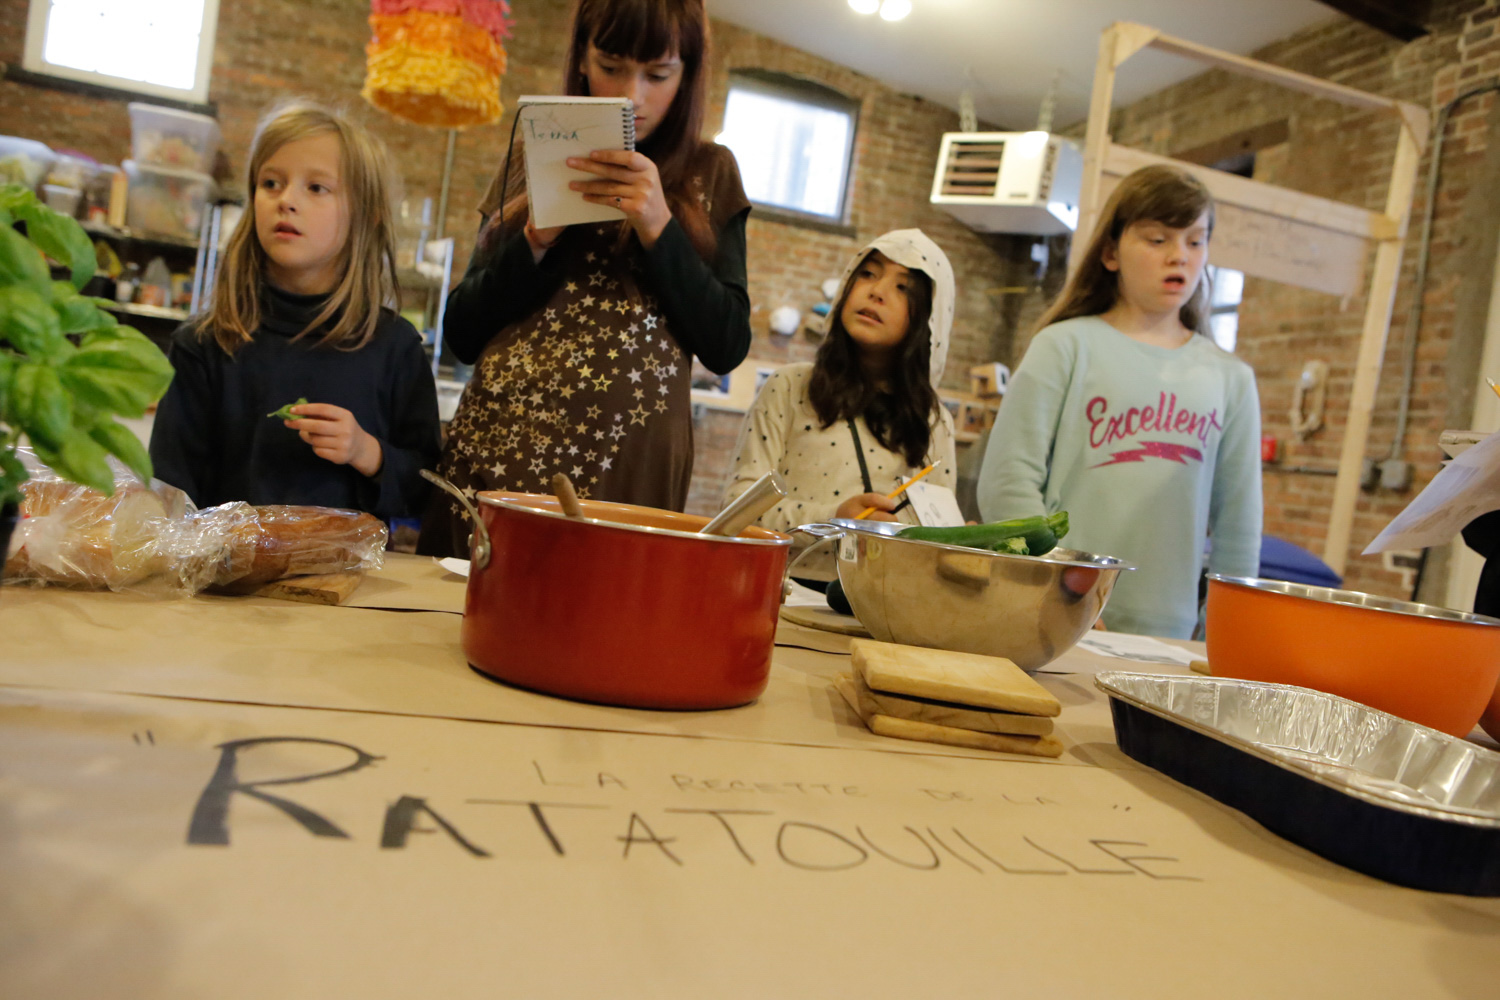
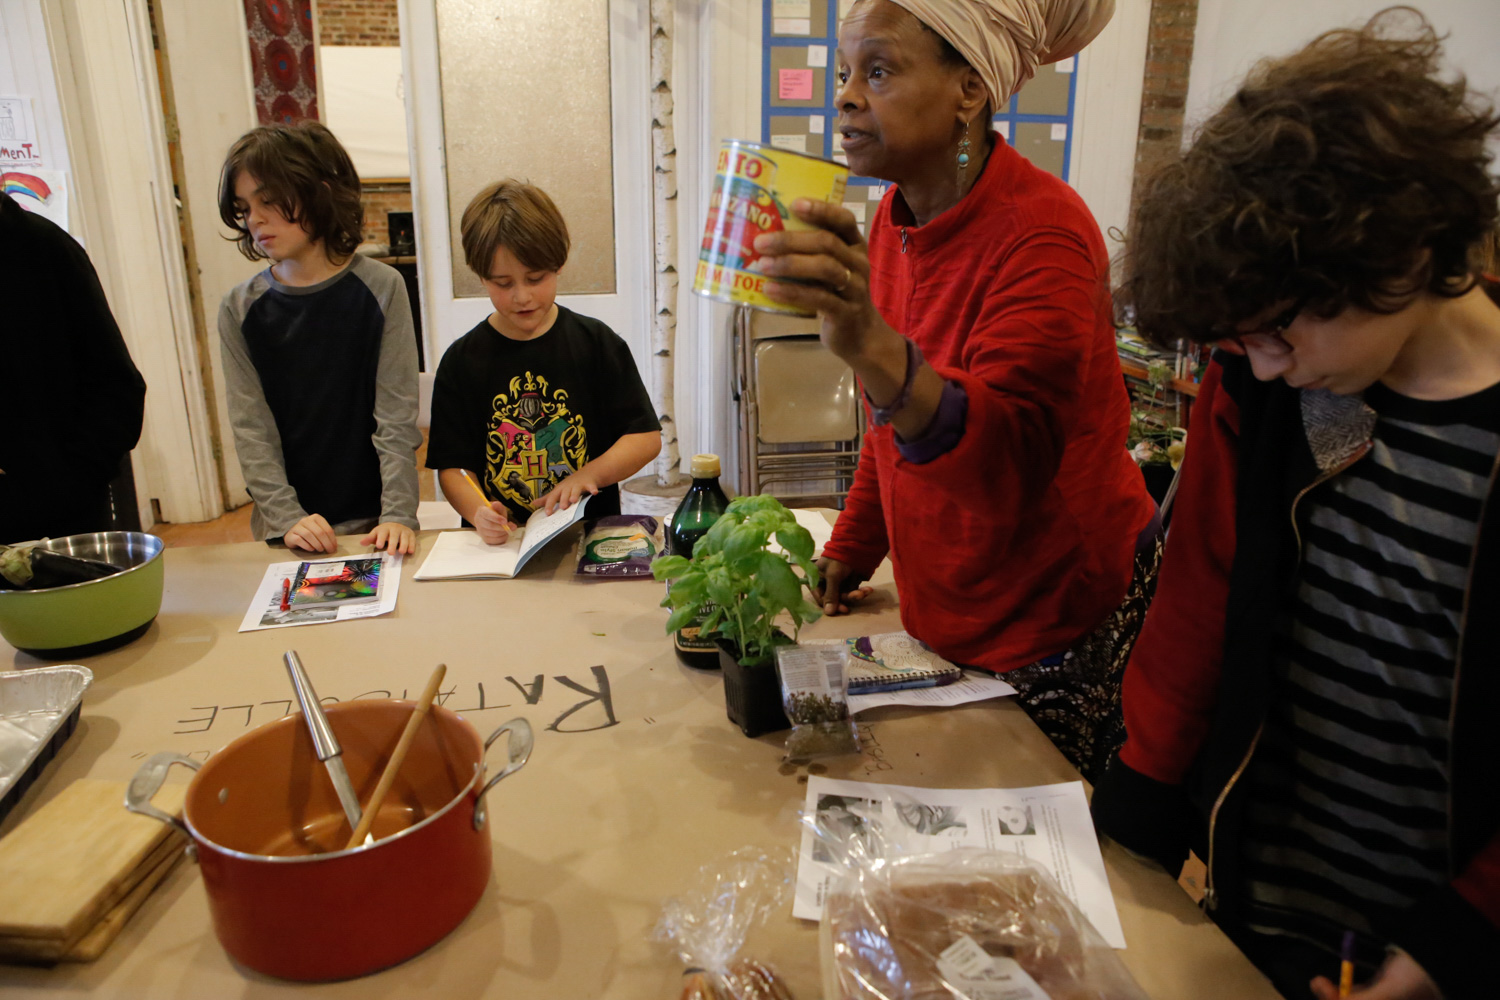
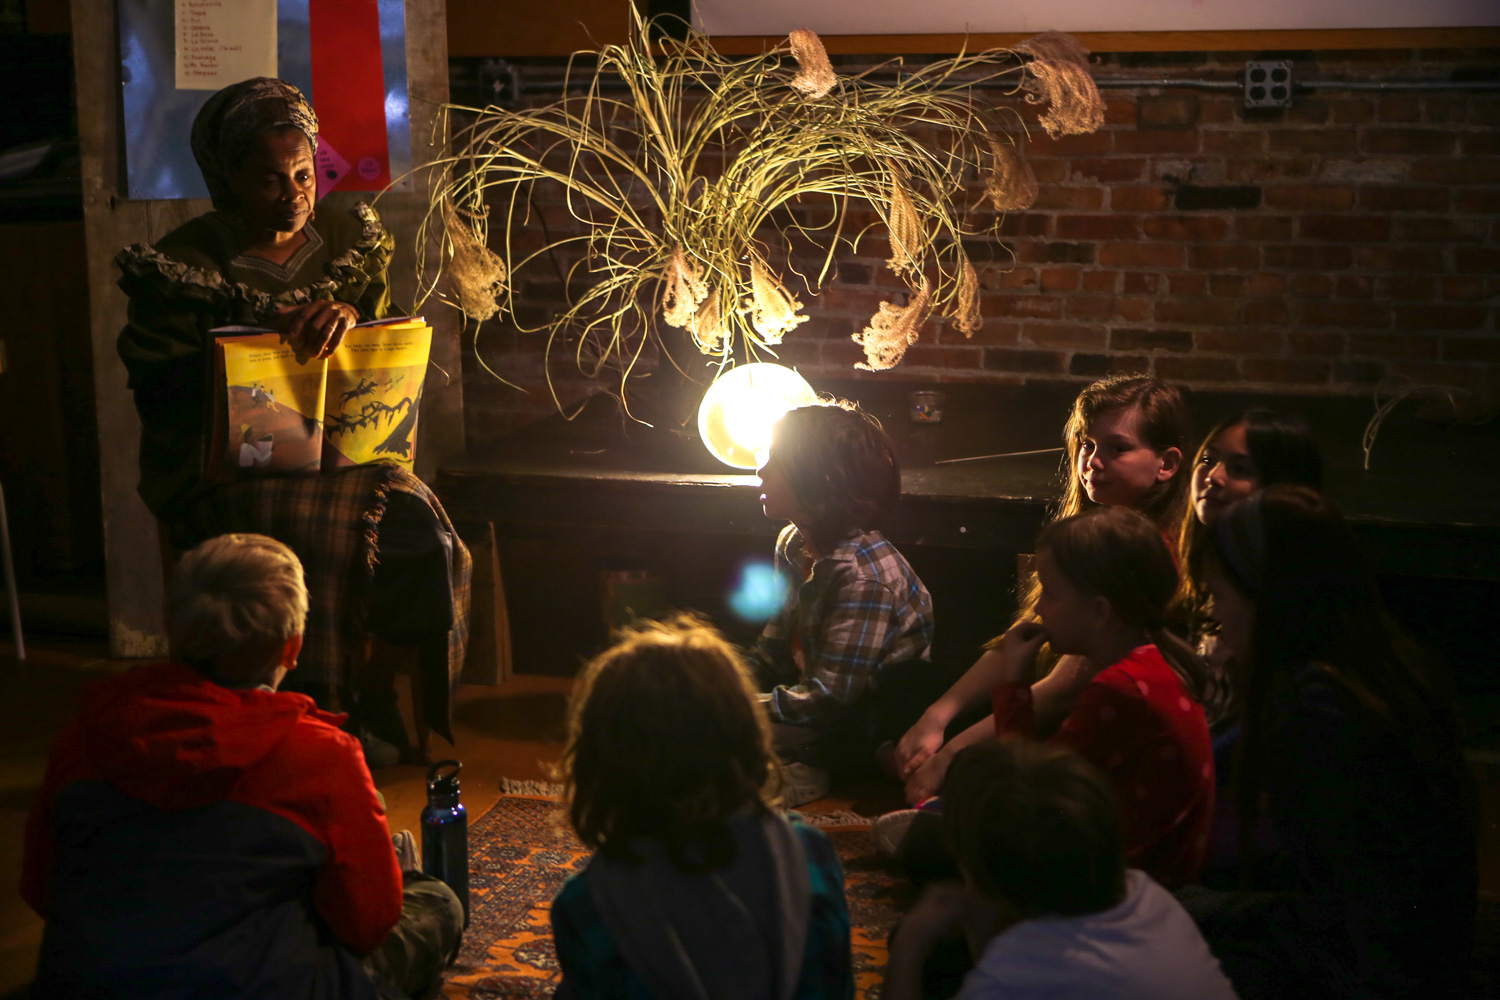
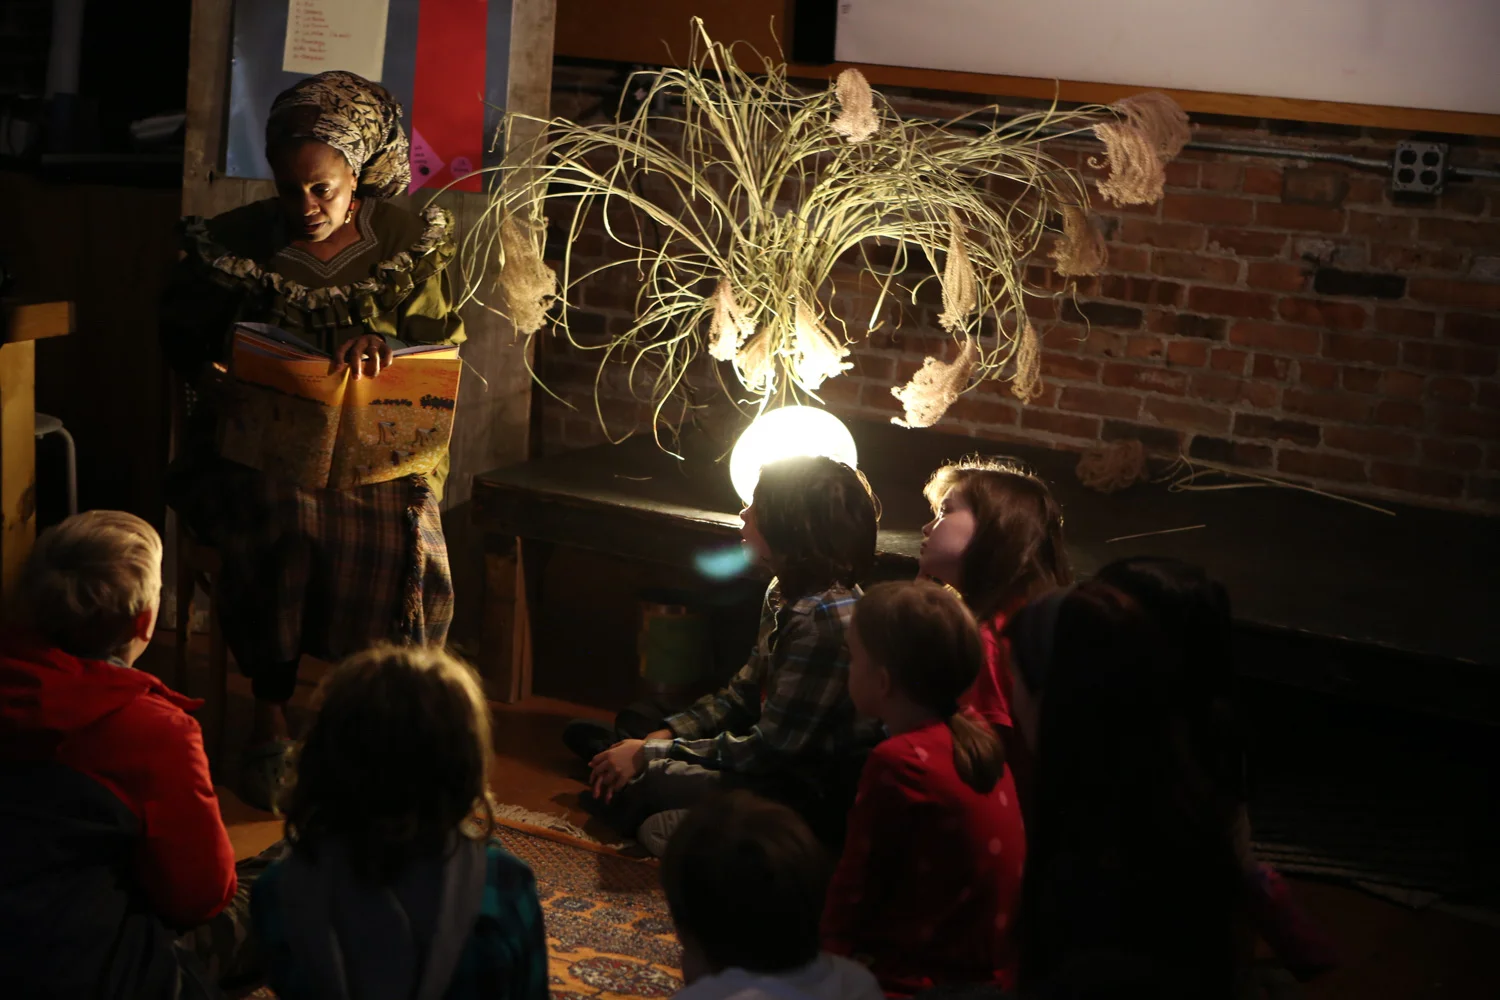
In this creative and immersive language class, students were introduced to the basics of French language through cooking, dancing, singing, reading stories, making art, watching films going on trips, and creating theater together.
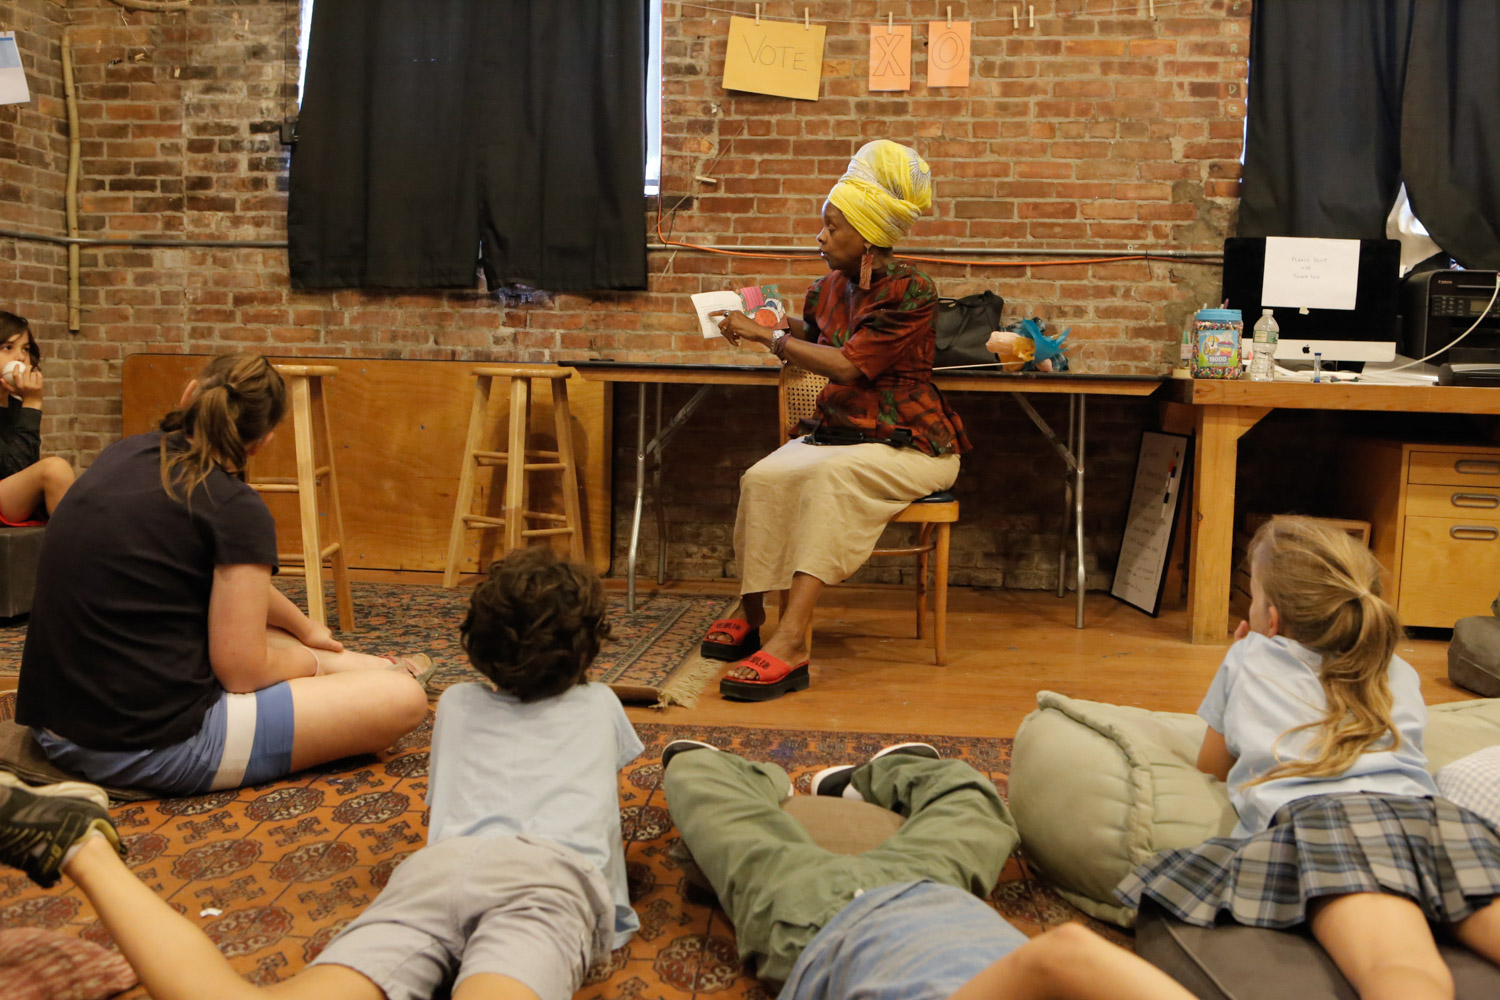
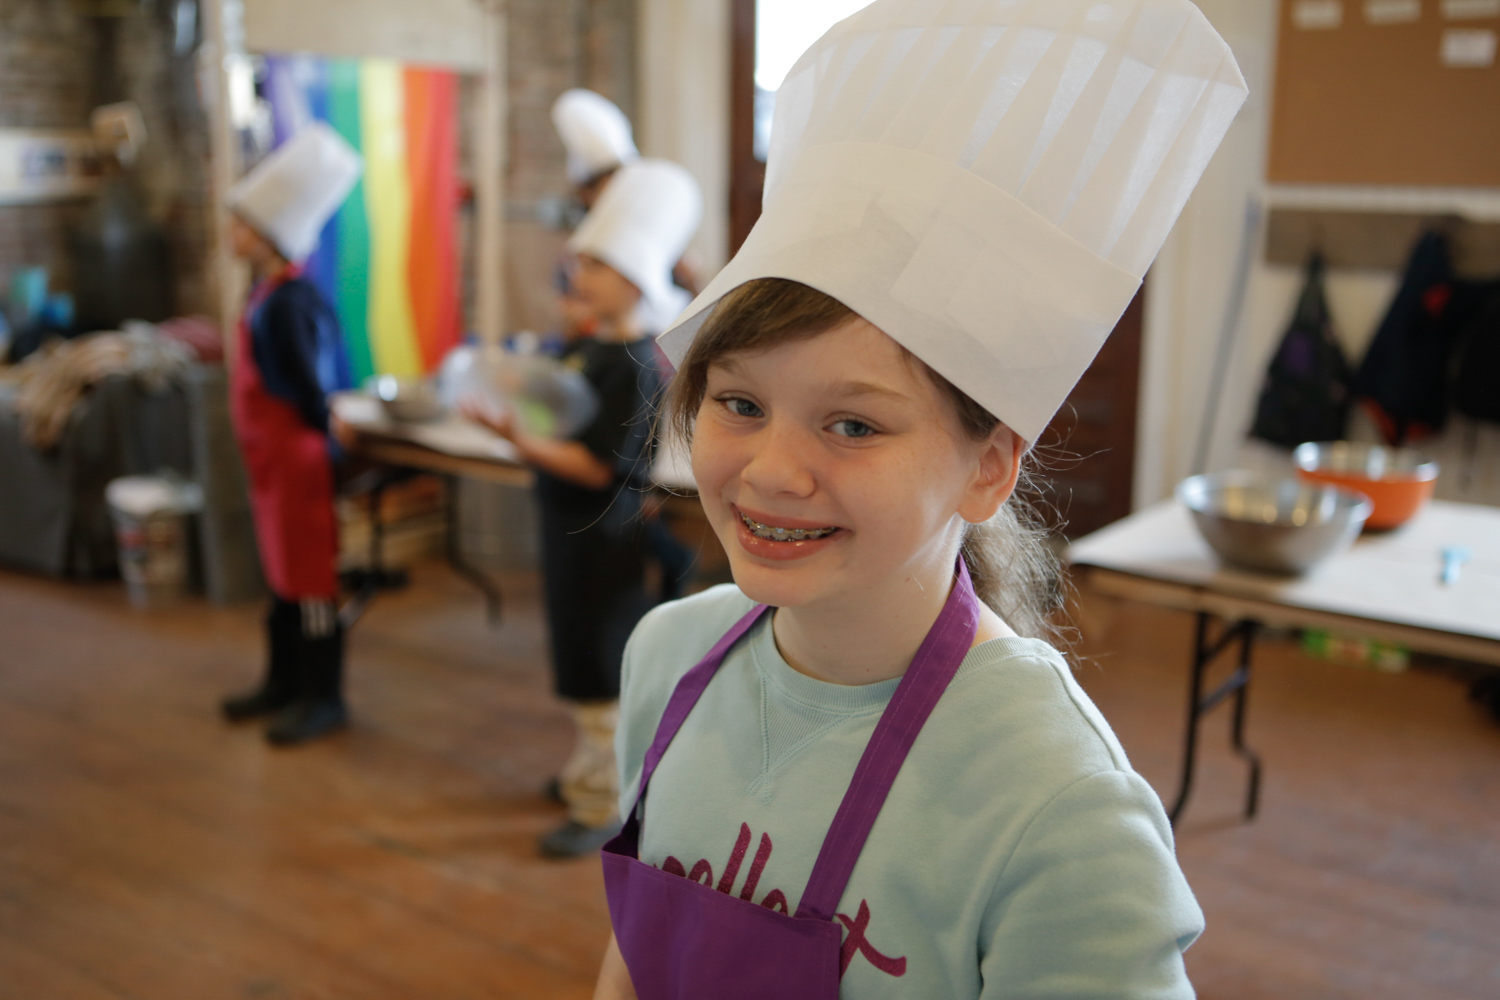
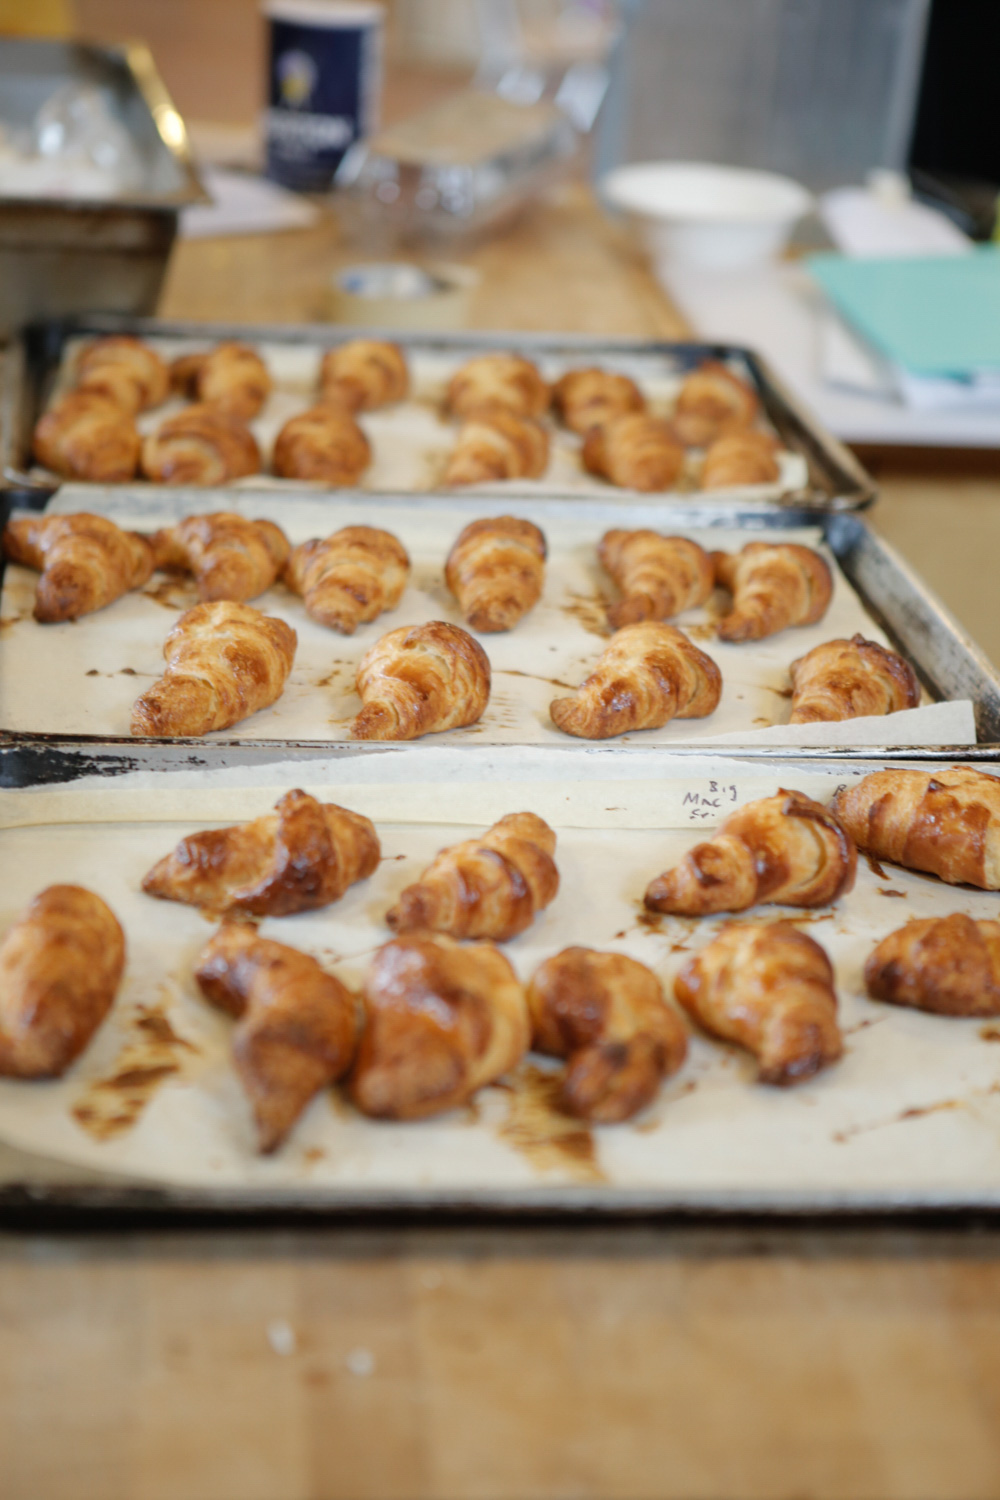
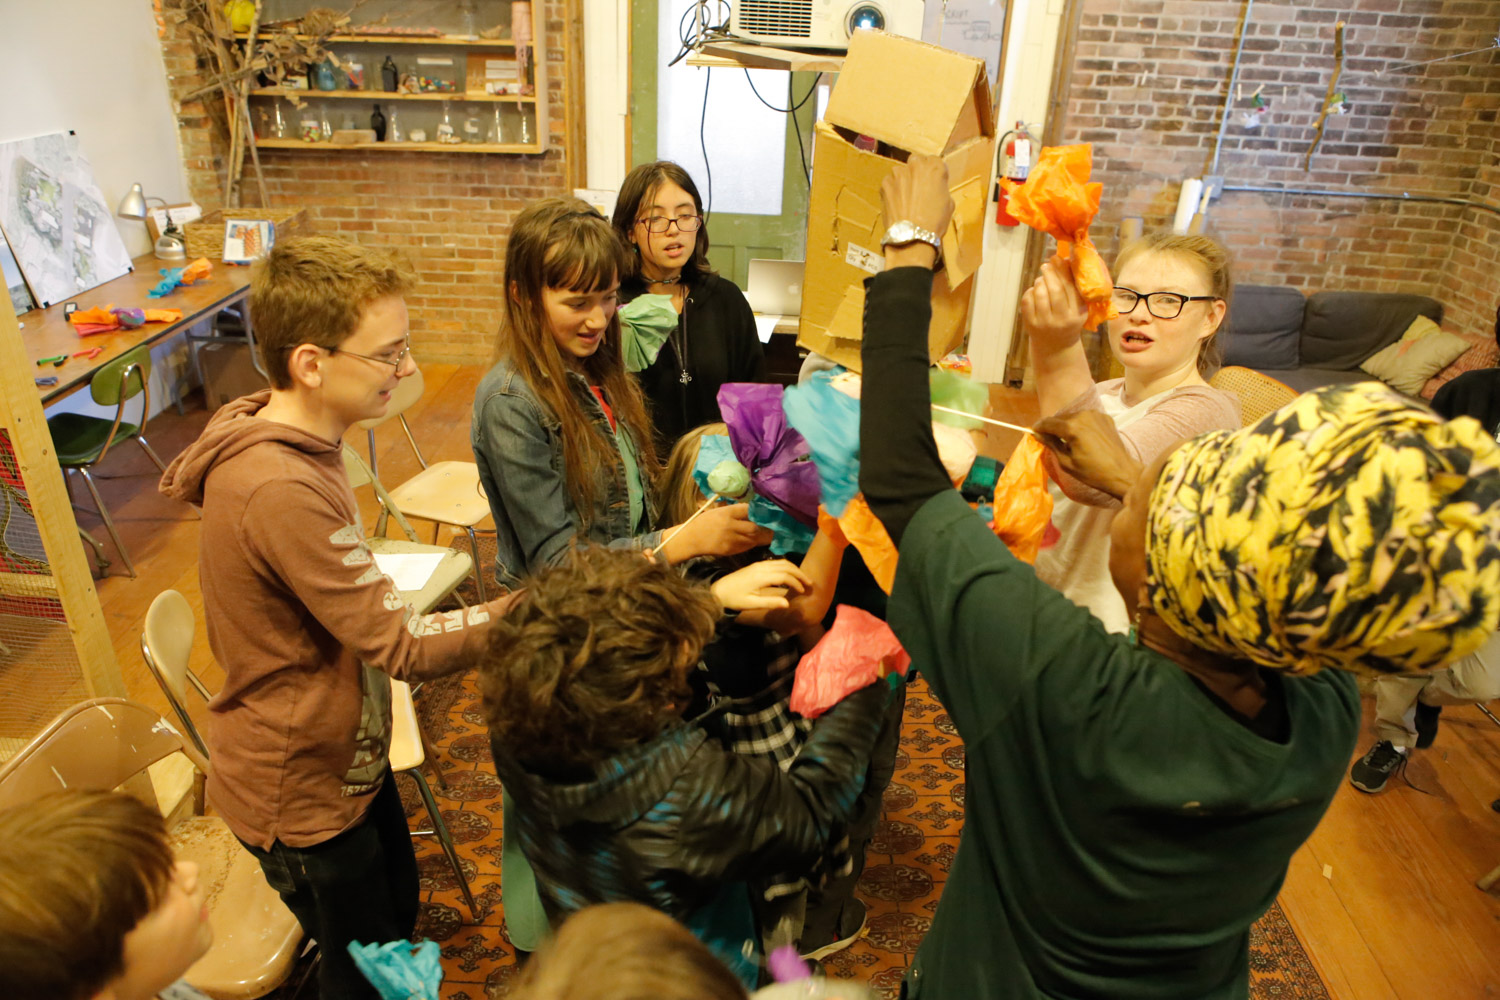
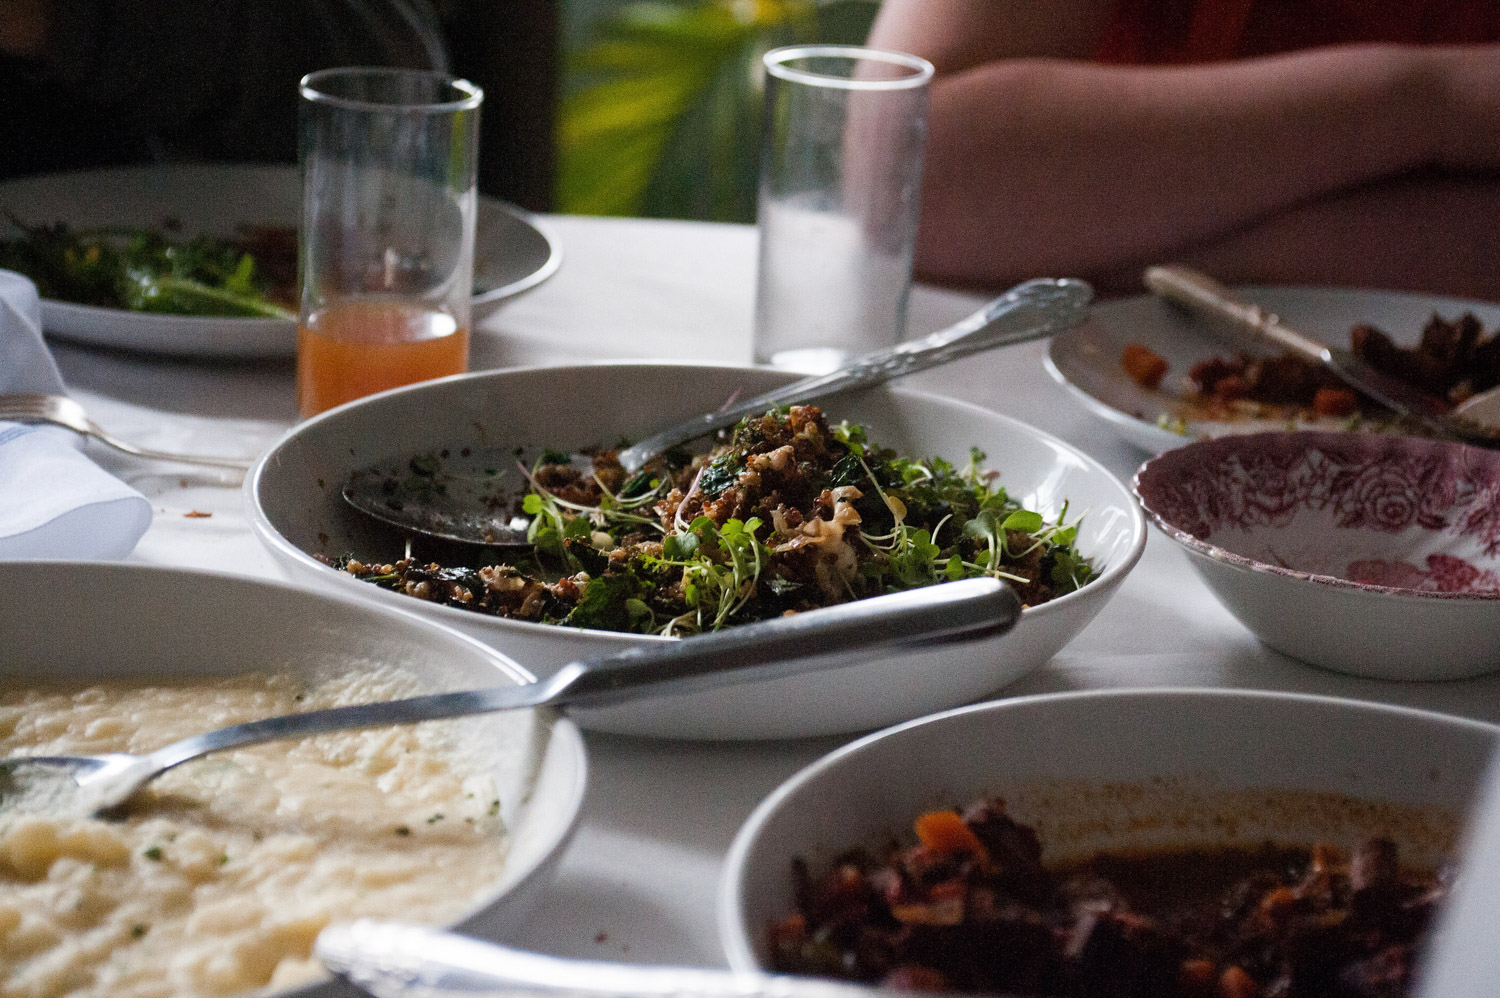
Students built their vocabularies throughout the semester, keeping journals and participating in the 100 word challenge, and covering the Kite’s Nest classroom with labels. We practiced our new words through games: playing Francophone freeze dance, our own version of JeoParty, and a game to cheer each other on - allez-y! We practiced the language through art projects: discussing colors and shapes as we made our own self-portraits; creating our own books to record words, magic spells, and notes; making tissue-paper butterflies and creating our own fantastical stories. We learned songs and rehearsed them together, and read and translated stories between French and English. We watched movies (like Ratatouille!), and went on field trips to Hawthorne Valley Farm and to a French dance class. We spent a lot of our time in character: learning travel vocabulary by pretending to take a bus in Montreal, and writing, translating, rehearsing and performing our own short plays. And, of course, we ate food! Guest Chef Ntangou lead us through the 6-hour process of making croissants, and we hosted our own performance and meal at Café Le Perche -- where we got to tour the restaurant and their 14-ton French oven.
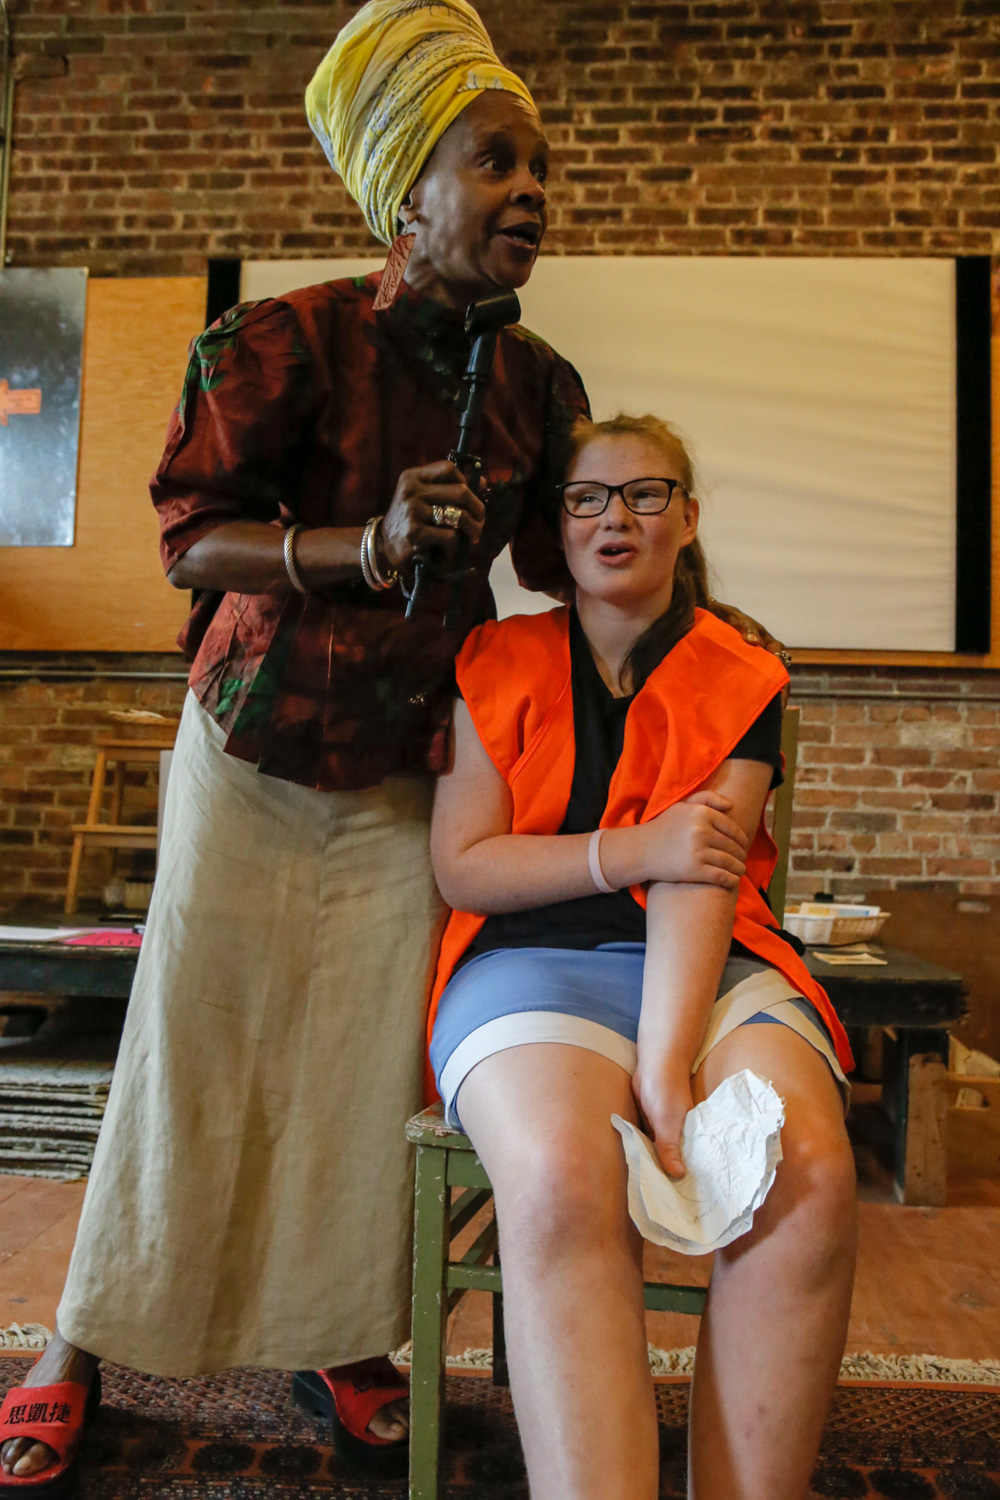
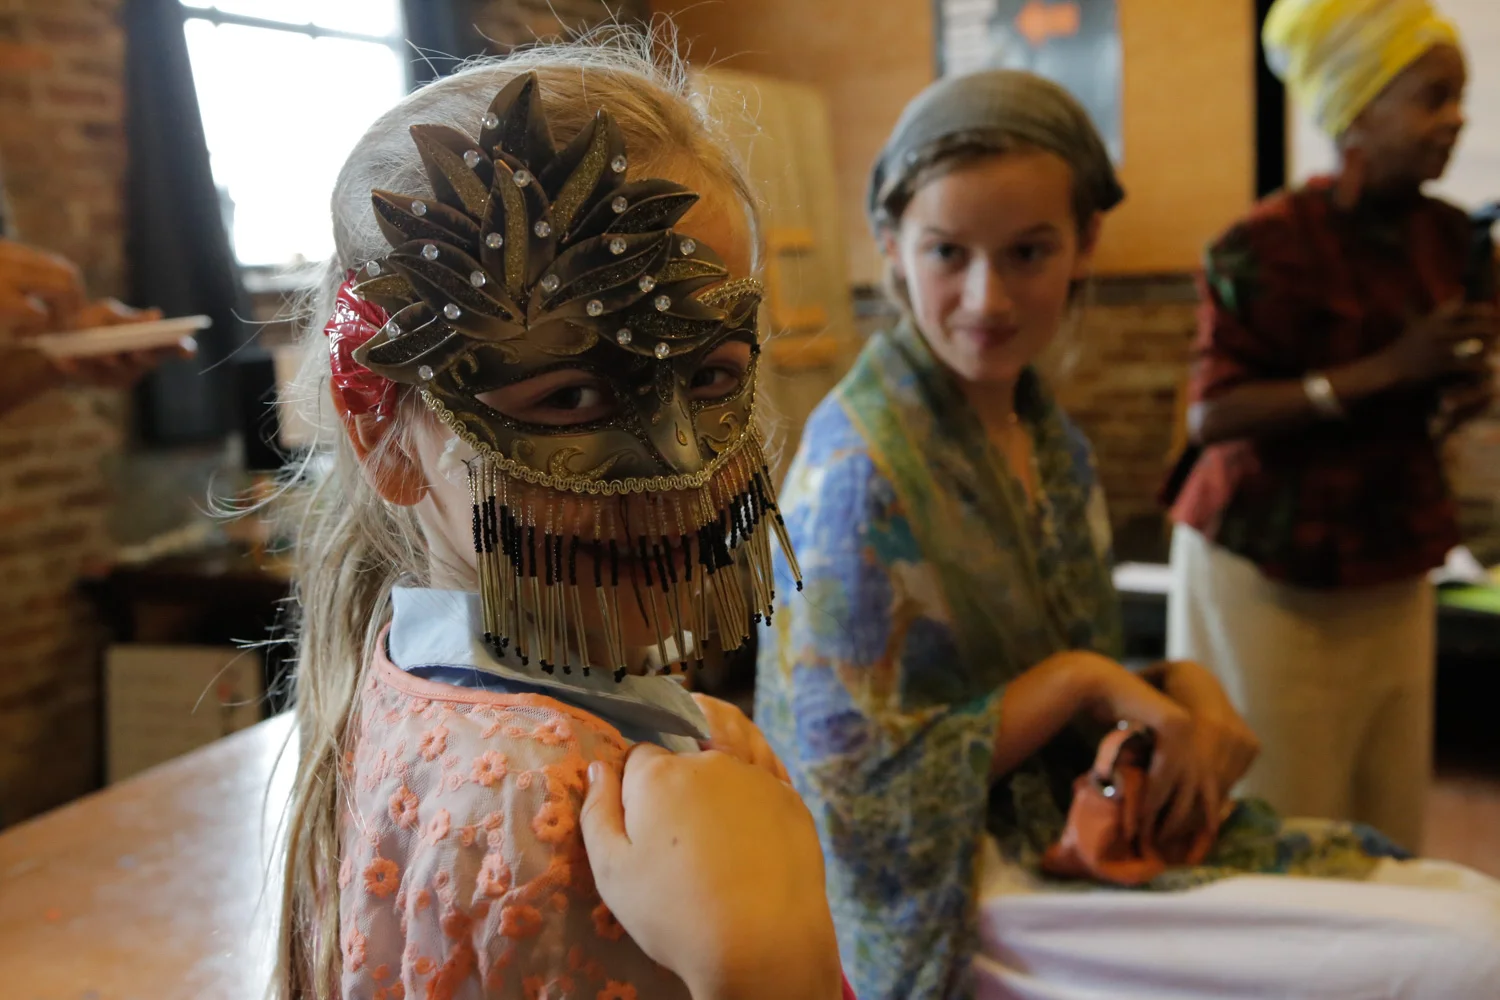
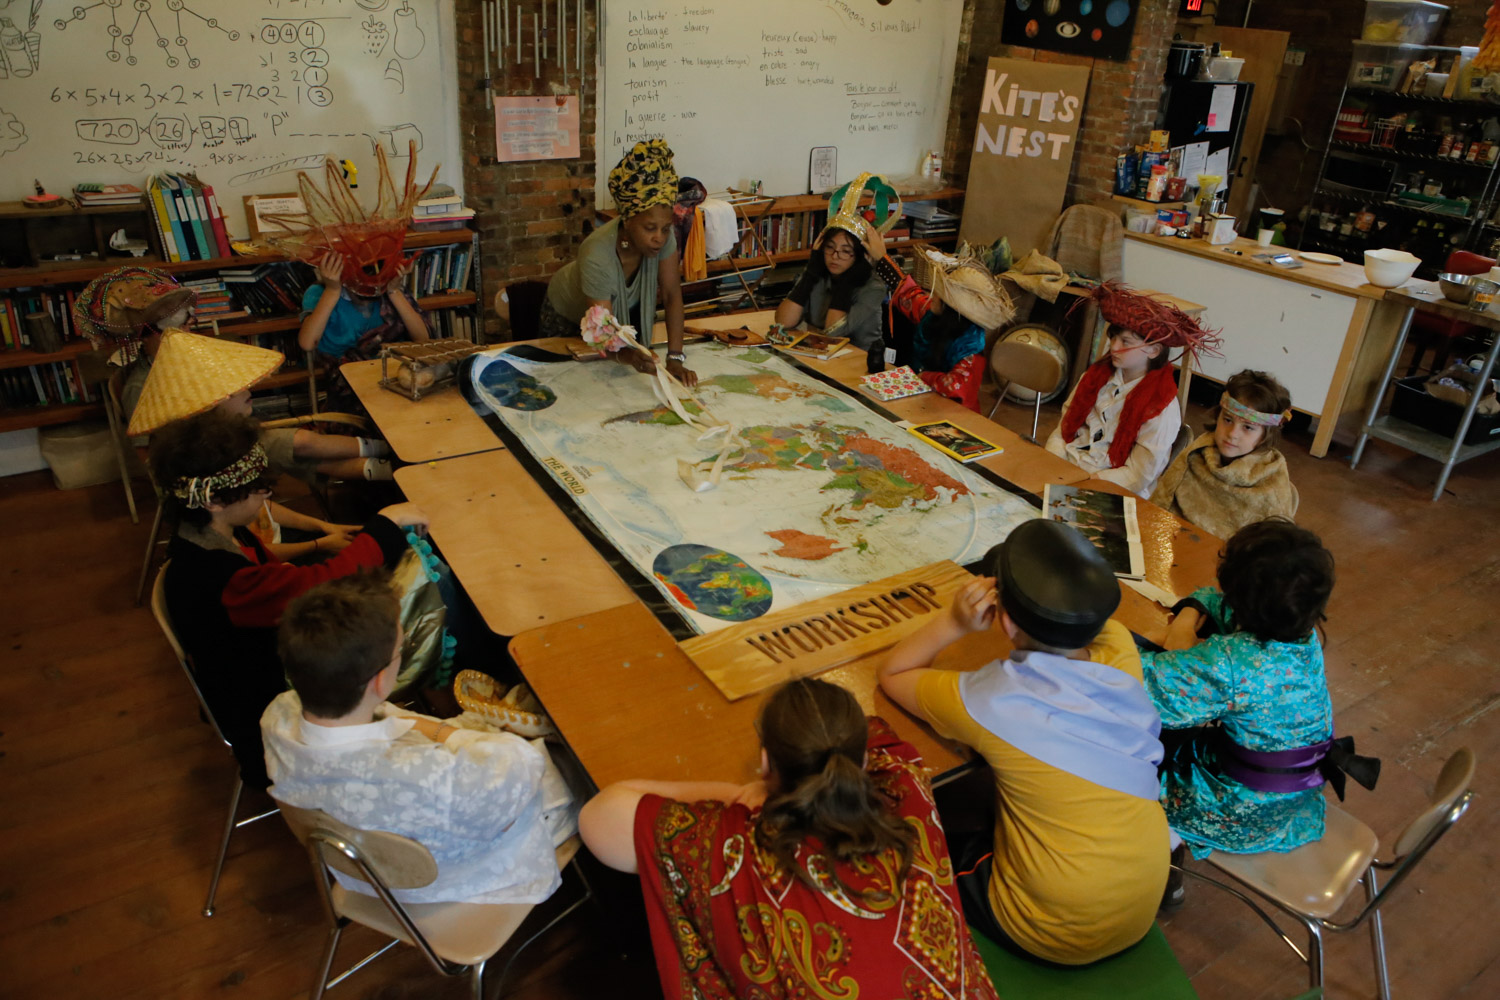
It was not only our goal to introduce students to the French language, but to the histories and geographies of French colonization around the world, and the immigrant influence in French culture. We spent time looking at a map of the French language together. In one class we engaged in a powerful historical role play, taking on the roles of Asian, African, Caribbean and Indigenous people in North America impacted by the arrival of French colonizers, and learning about the experience of colonization -- following the activity with a discussion to unpack our responses and emotions about these histories of domination and resistance. We learned also about French Resistance in World War II, and watched a documentary about the artist and French resistance freedom fighter Josephine Baker. We had a dance party to celebrate artists from Le Congo, l’Haiti, and La Martinique. And we learned about the French Creole region of New Orleans, reading about Congo Square -- where both enslaved and free Africans were permitted to to join together on Sundays to engage in their familiar music, songs, dances, and foods.
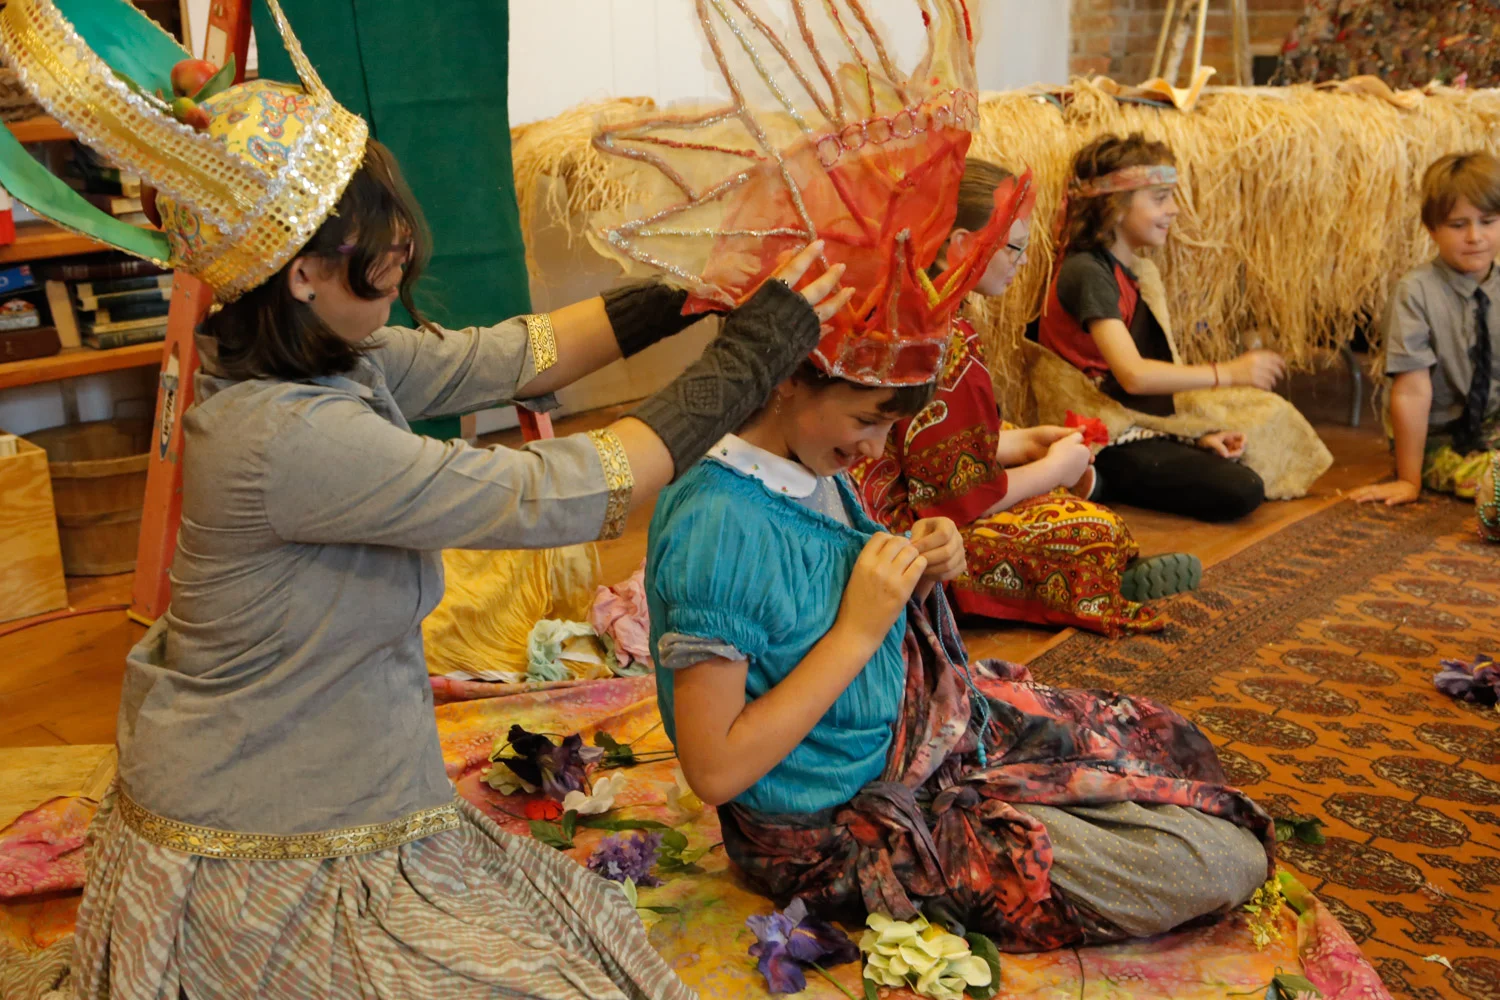
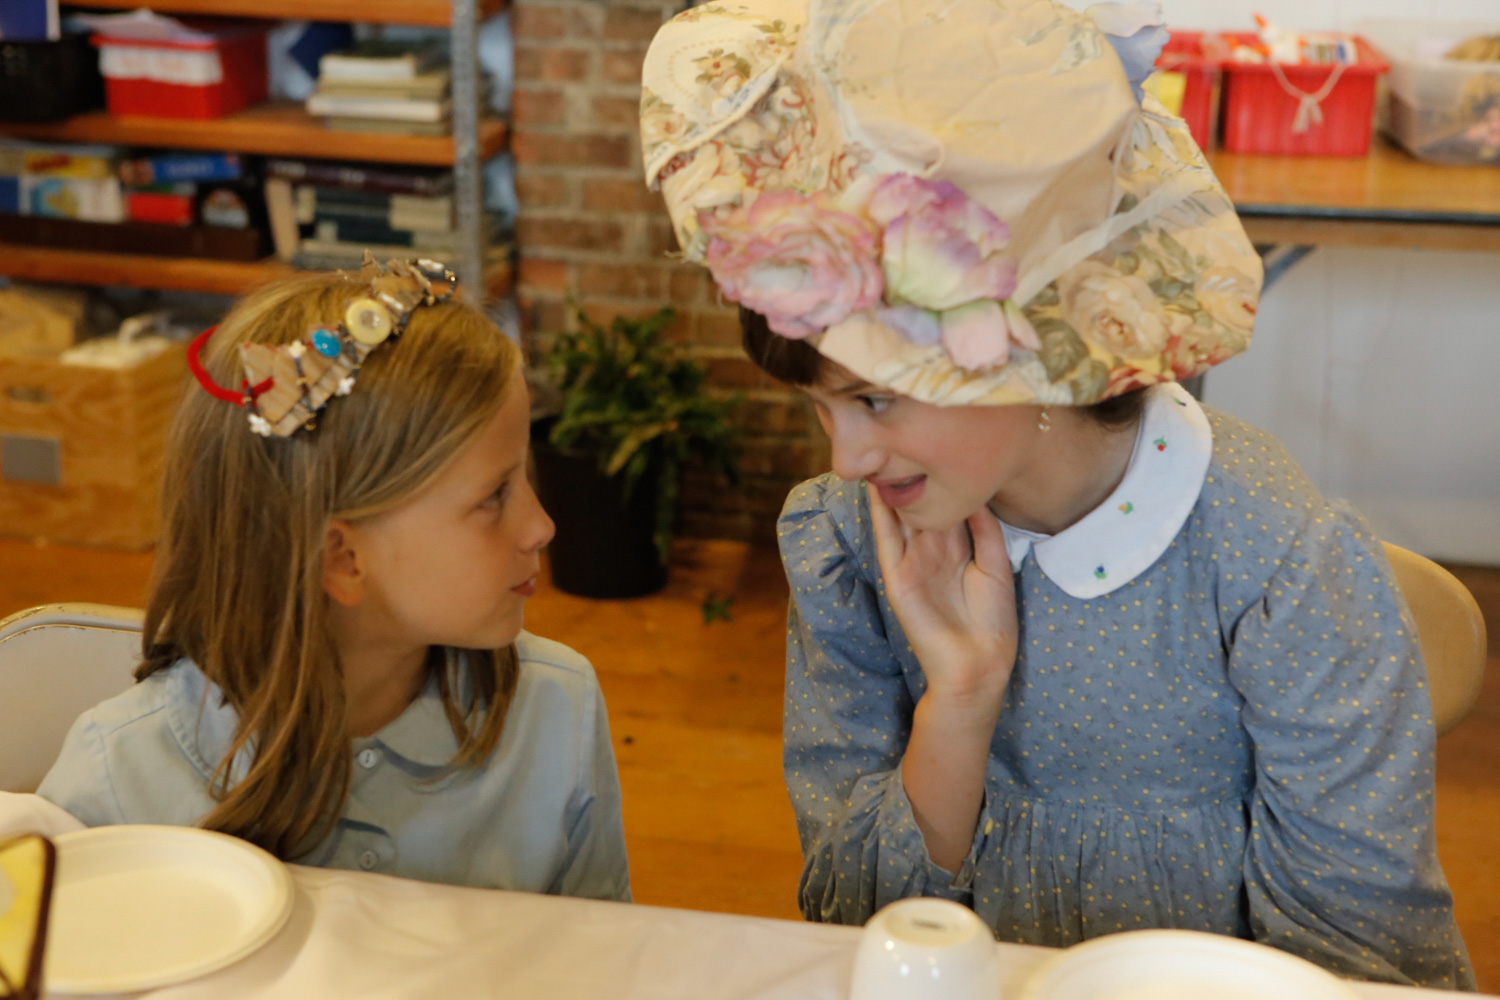
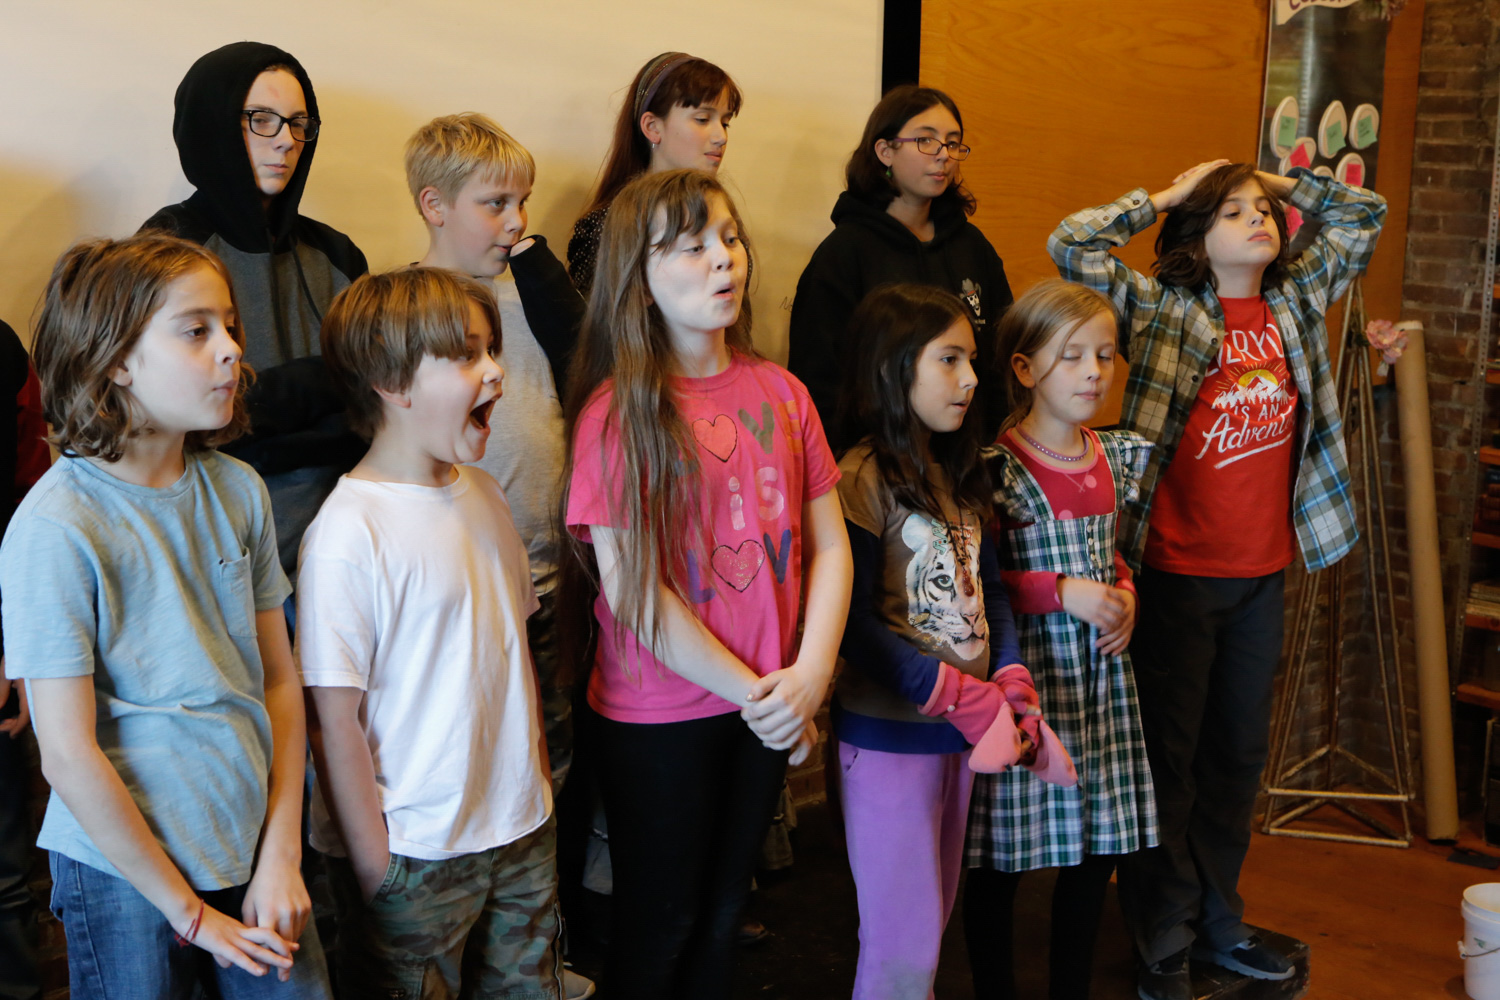
At the end of our semester together, we spent our time rehearsing our own play in French -- practicing our lines, blocking our scenes with costumes and props, supporting each other through stage fright, and choosing to record our play rather than perform it live! Check out our final production.


HOW WE GOT TO NOW
Mondays, 9:30am - 3:00pm | Ages 8 - 14 | September - December 2019
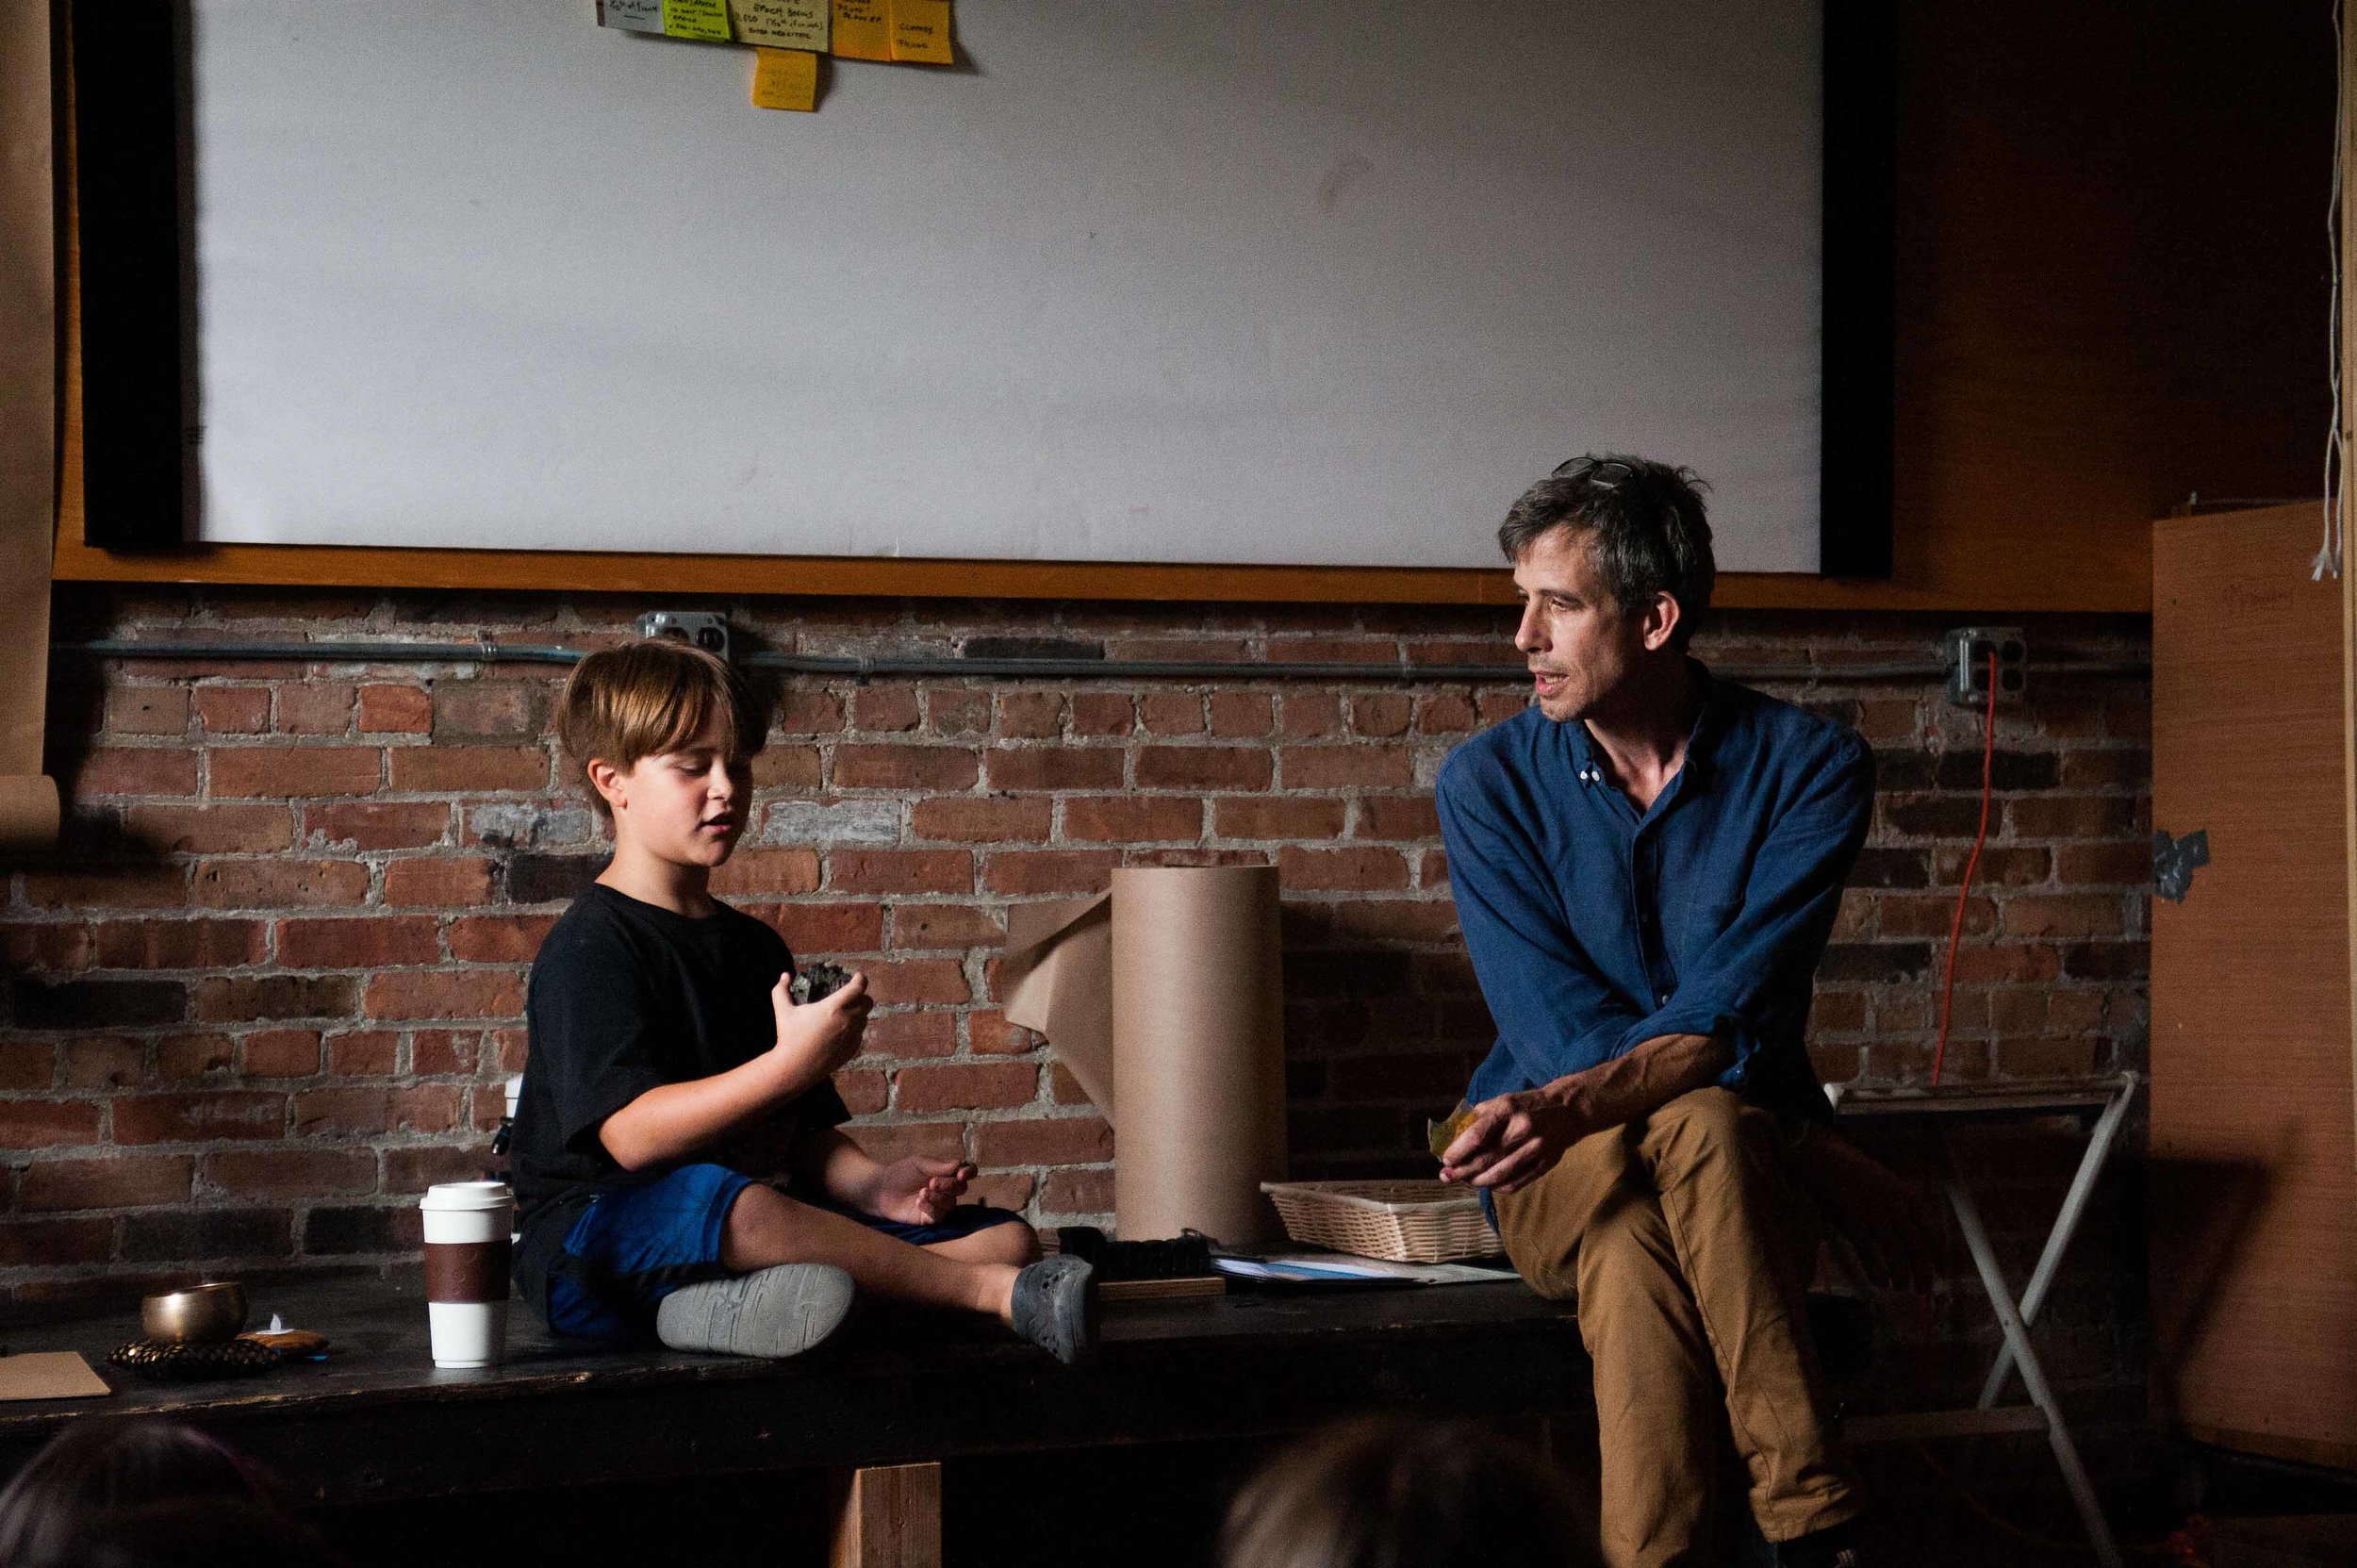
Time travel from the Paleolithic to Generation Z. With Kevin Bose and David Eustace.
In this class we spanned thousands of years of history over the course of one semester -- engaging in hands-on games and activities to explore and understand concepts like geological time, population growth, industrialization, and climate change.
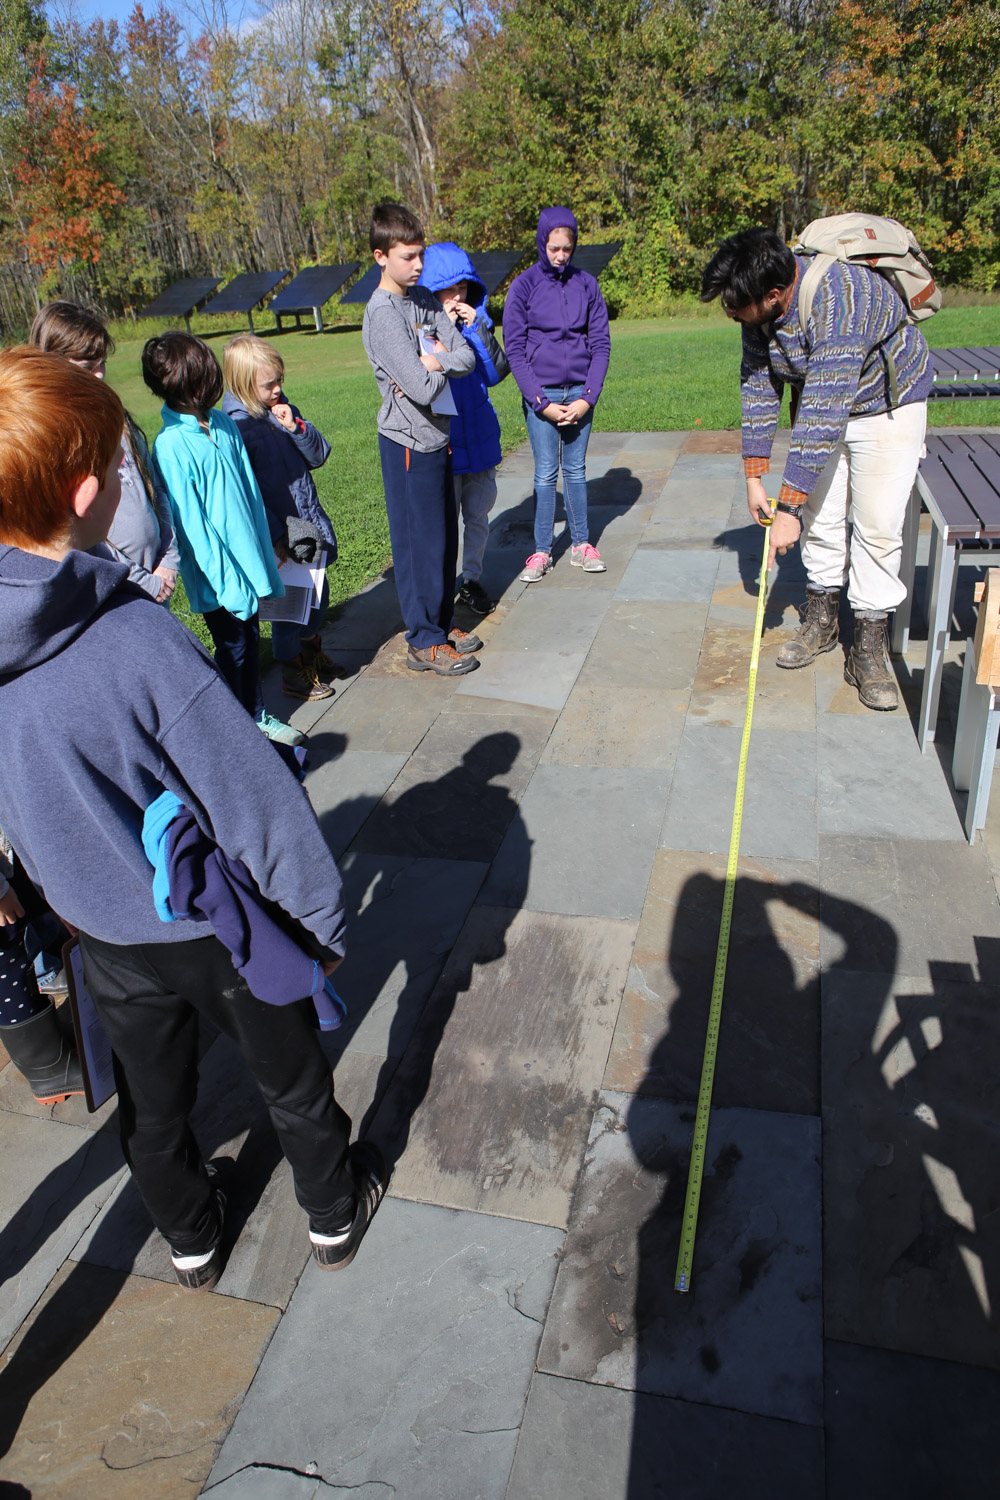
We began our class by zooming out: first using exercises with string to learn about scale, and then unrolling a giant paper timeline representing the life-span of all the earth (4.6 billion years). The timeline spanned the length of Kite’s Nest, but all of human existence was marked with a black line just ½ inch thick at the end of the scroll! We also began the semester by considering the challenges of studying history. We heard myths and stories about the history of humans in the world, and we played a historic “Telephone” game to mimic the challenges of interpreting historical narratives and to examine the power dynamics that shape our written histories. In small groups we conducted research through the lens of historians, scientists, builders and artists -- considering how our various perspectives and viewpoints shape what questions we ask and what clues we look for.
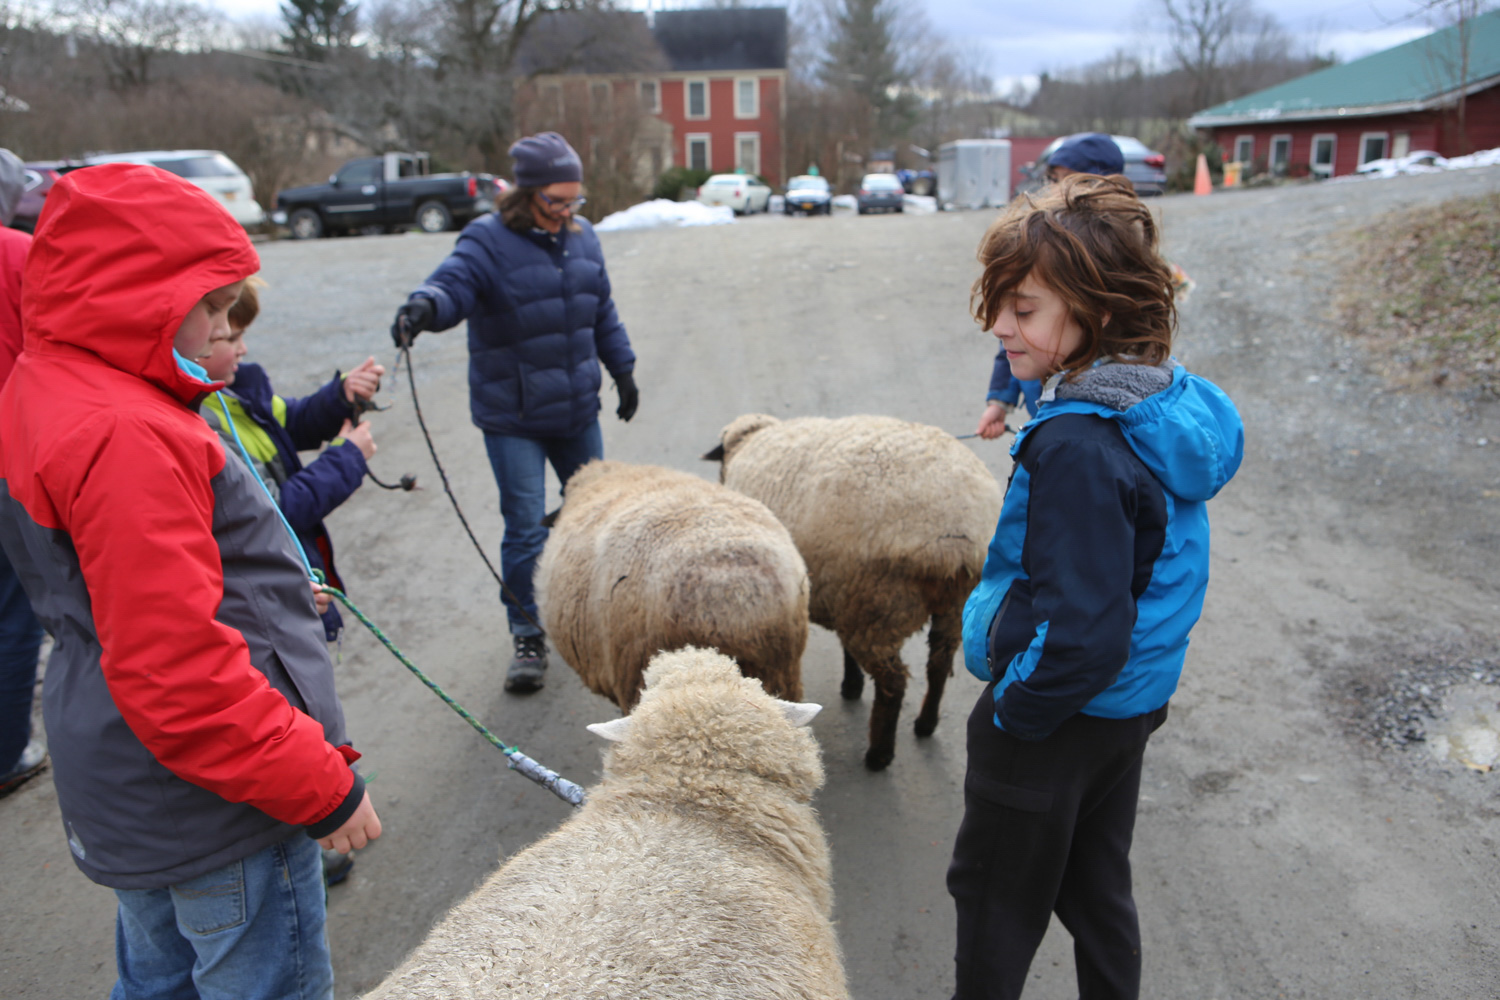
We also explored the framework of humans as social beings: learning about other animals to understand how socialization aides in species survival; and tracing the lineage of food products in our pantry to map out the global interdependence of our lives. Through games, role plays and activities we considered various structures for decision-making among humans: learning about hierarchical and egalitarian decision-making and governance structures, and unpacking our experiences of feeling powerless and powerful in group process.
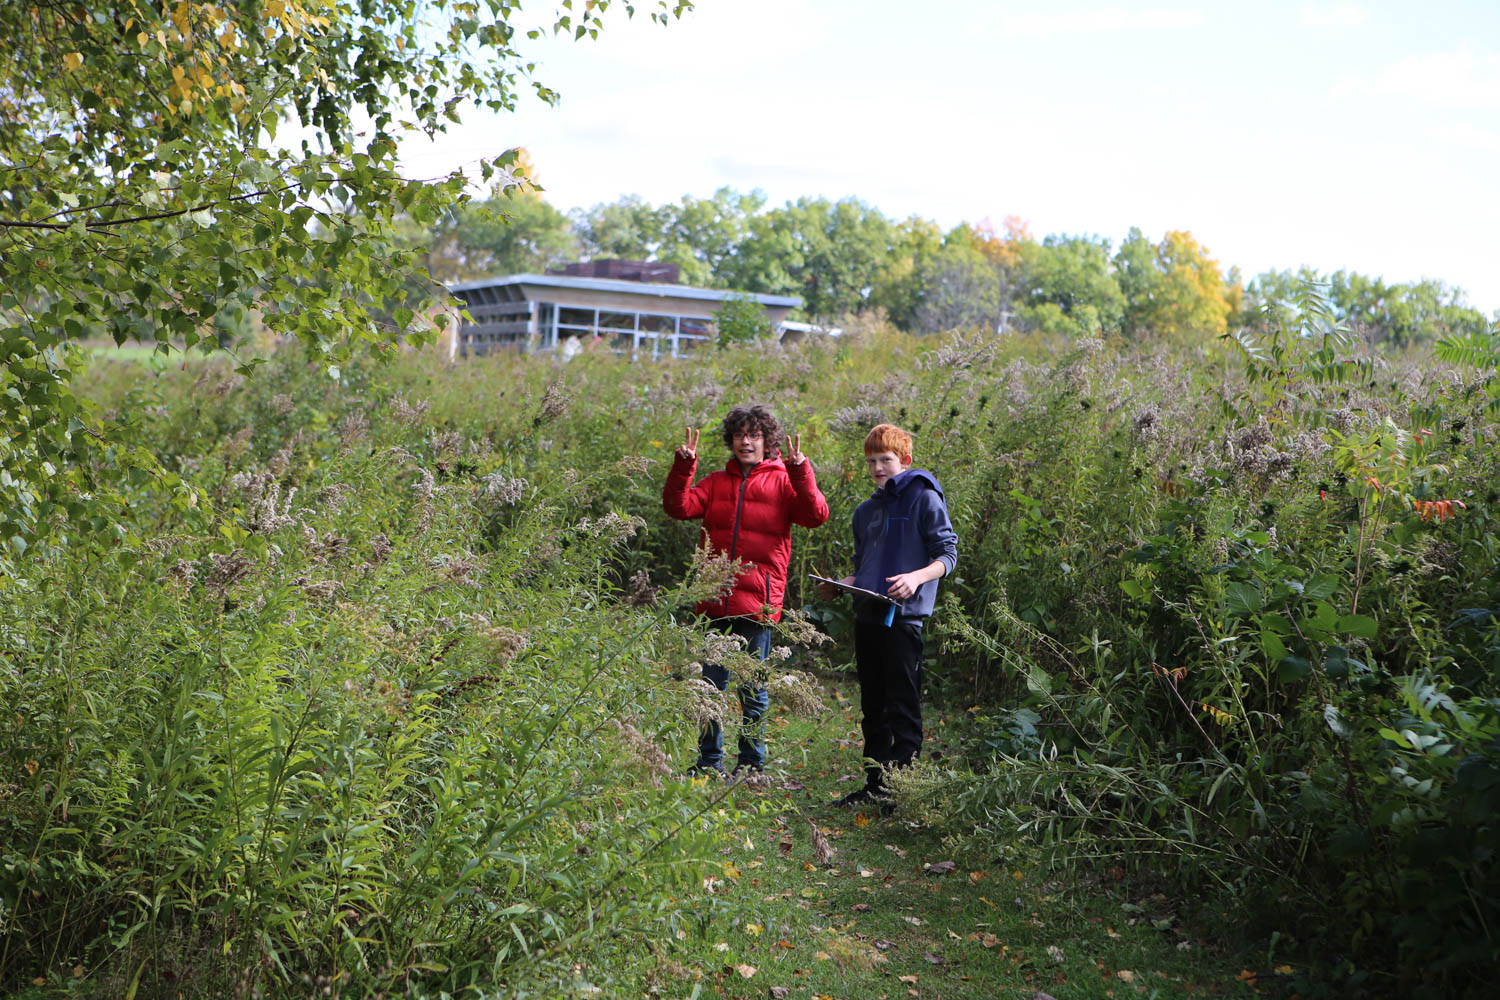
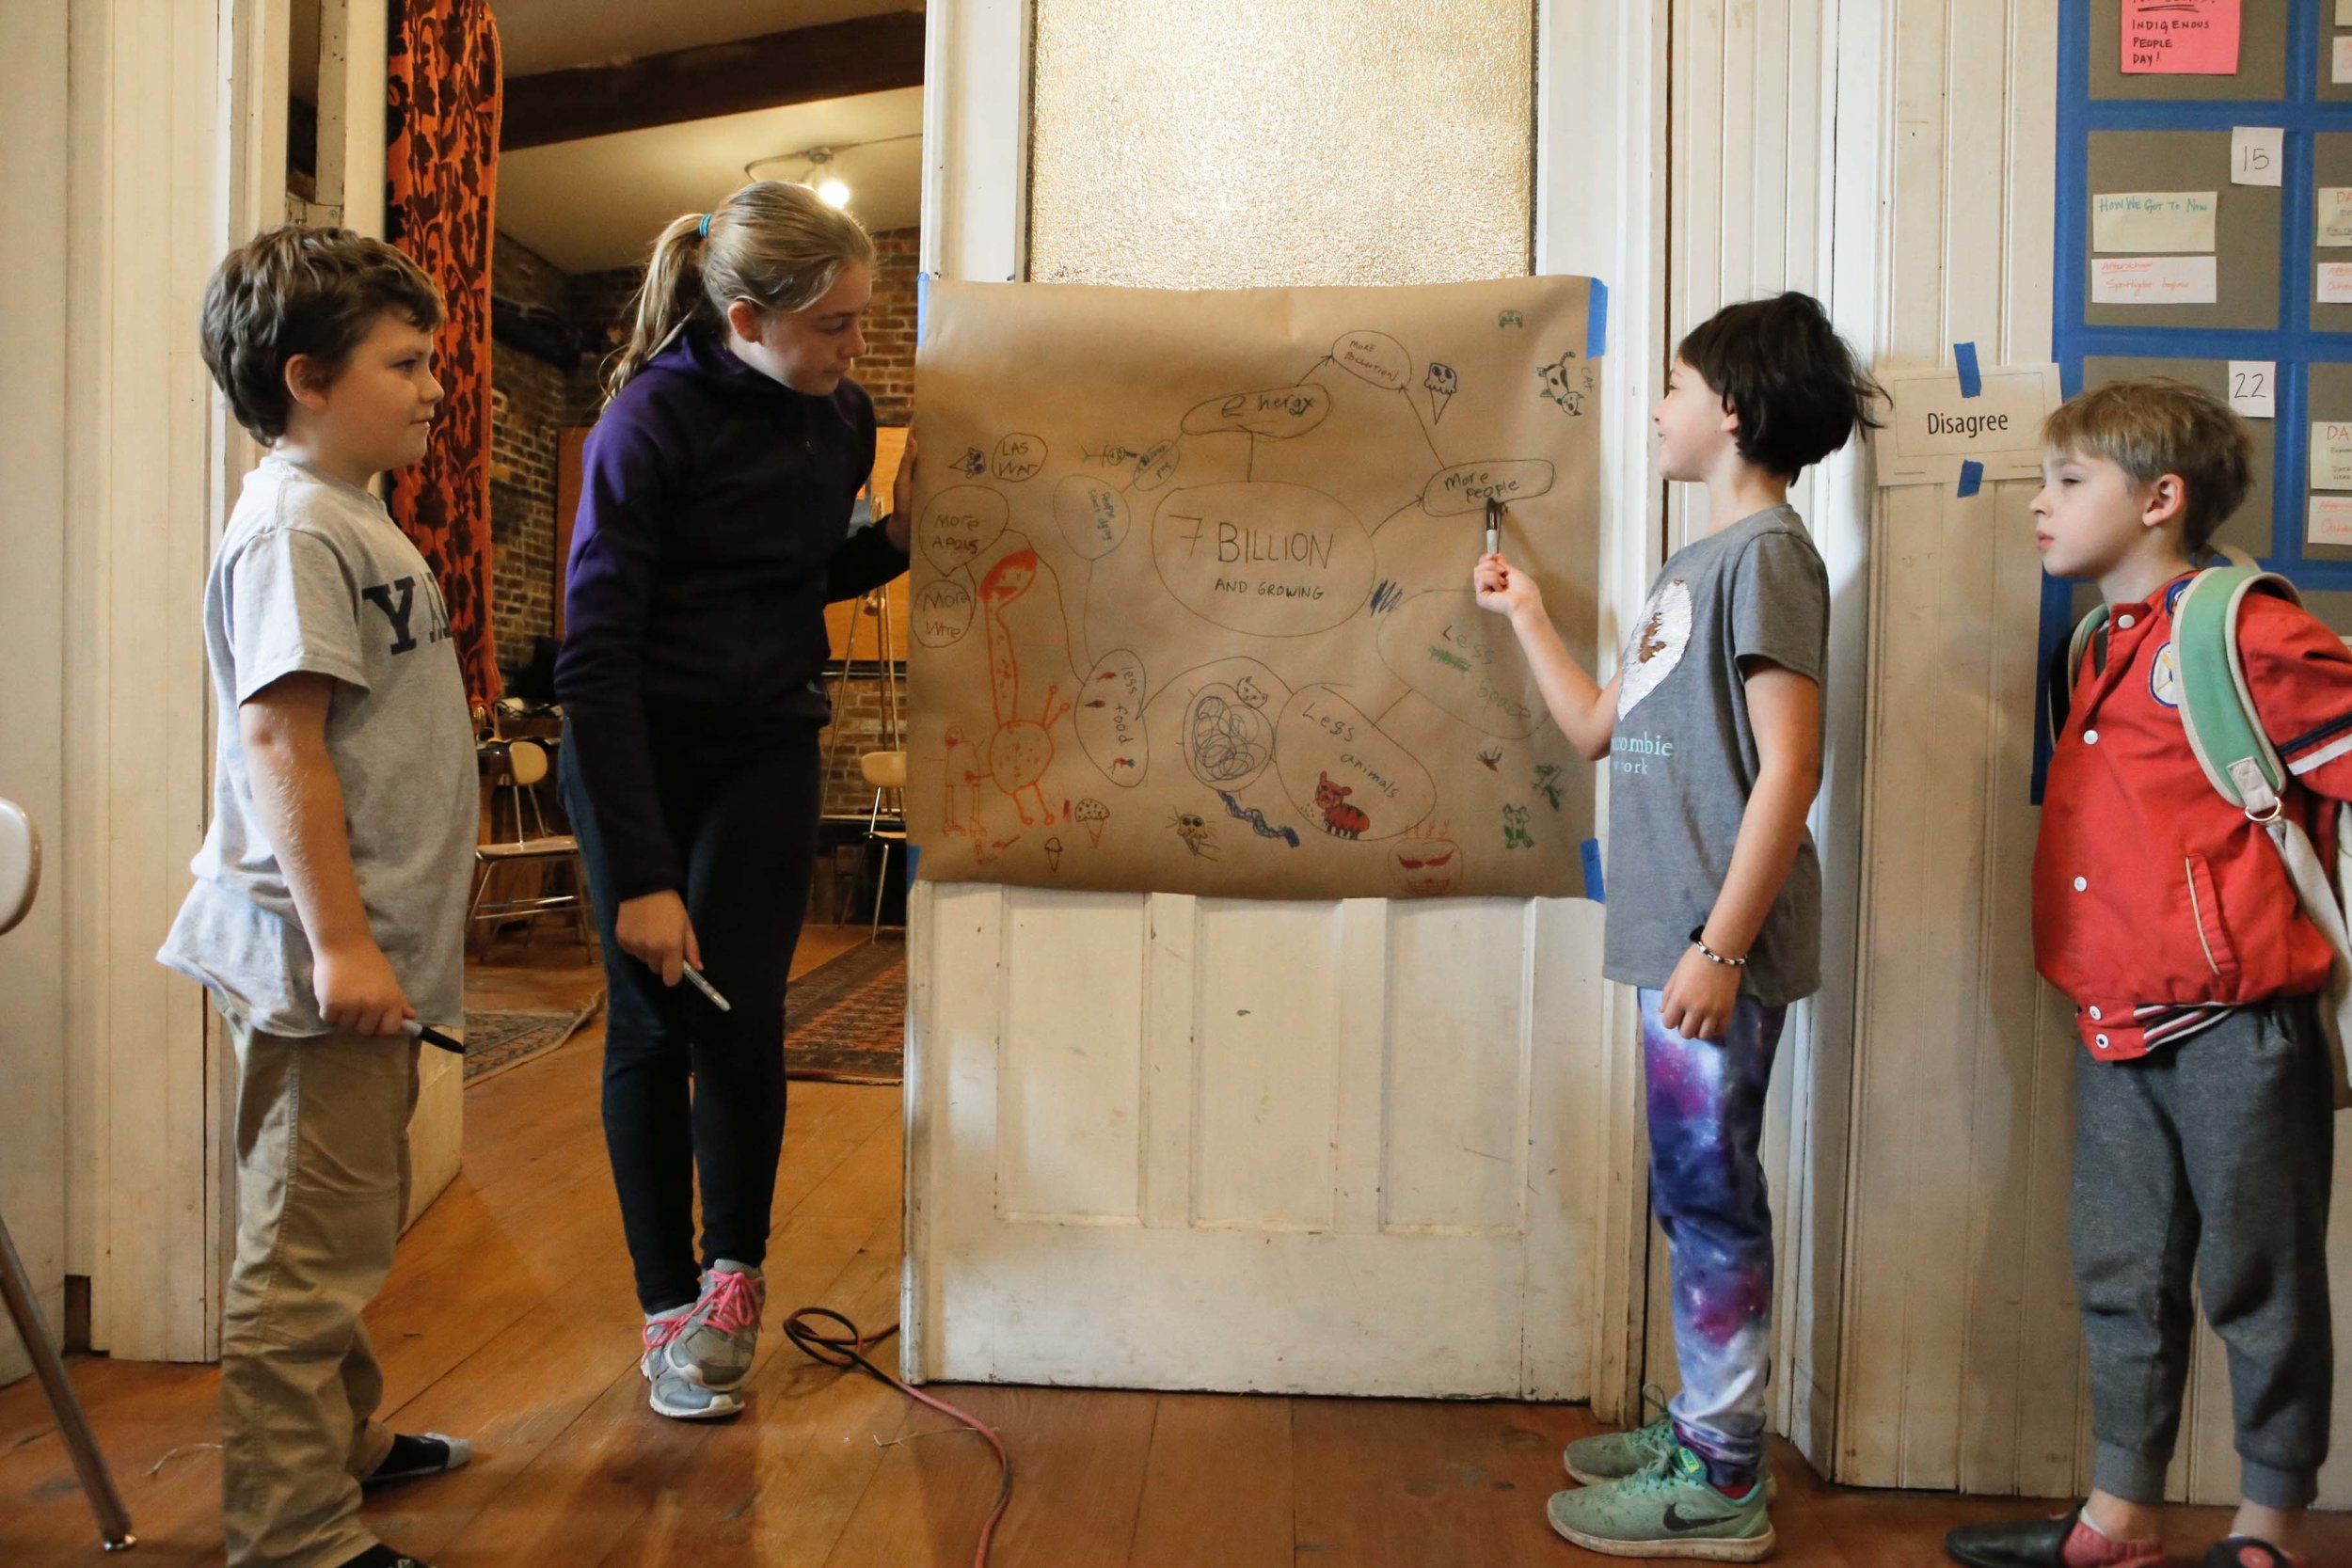
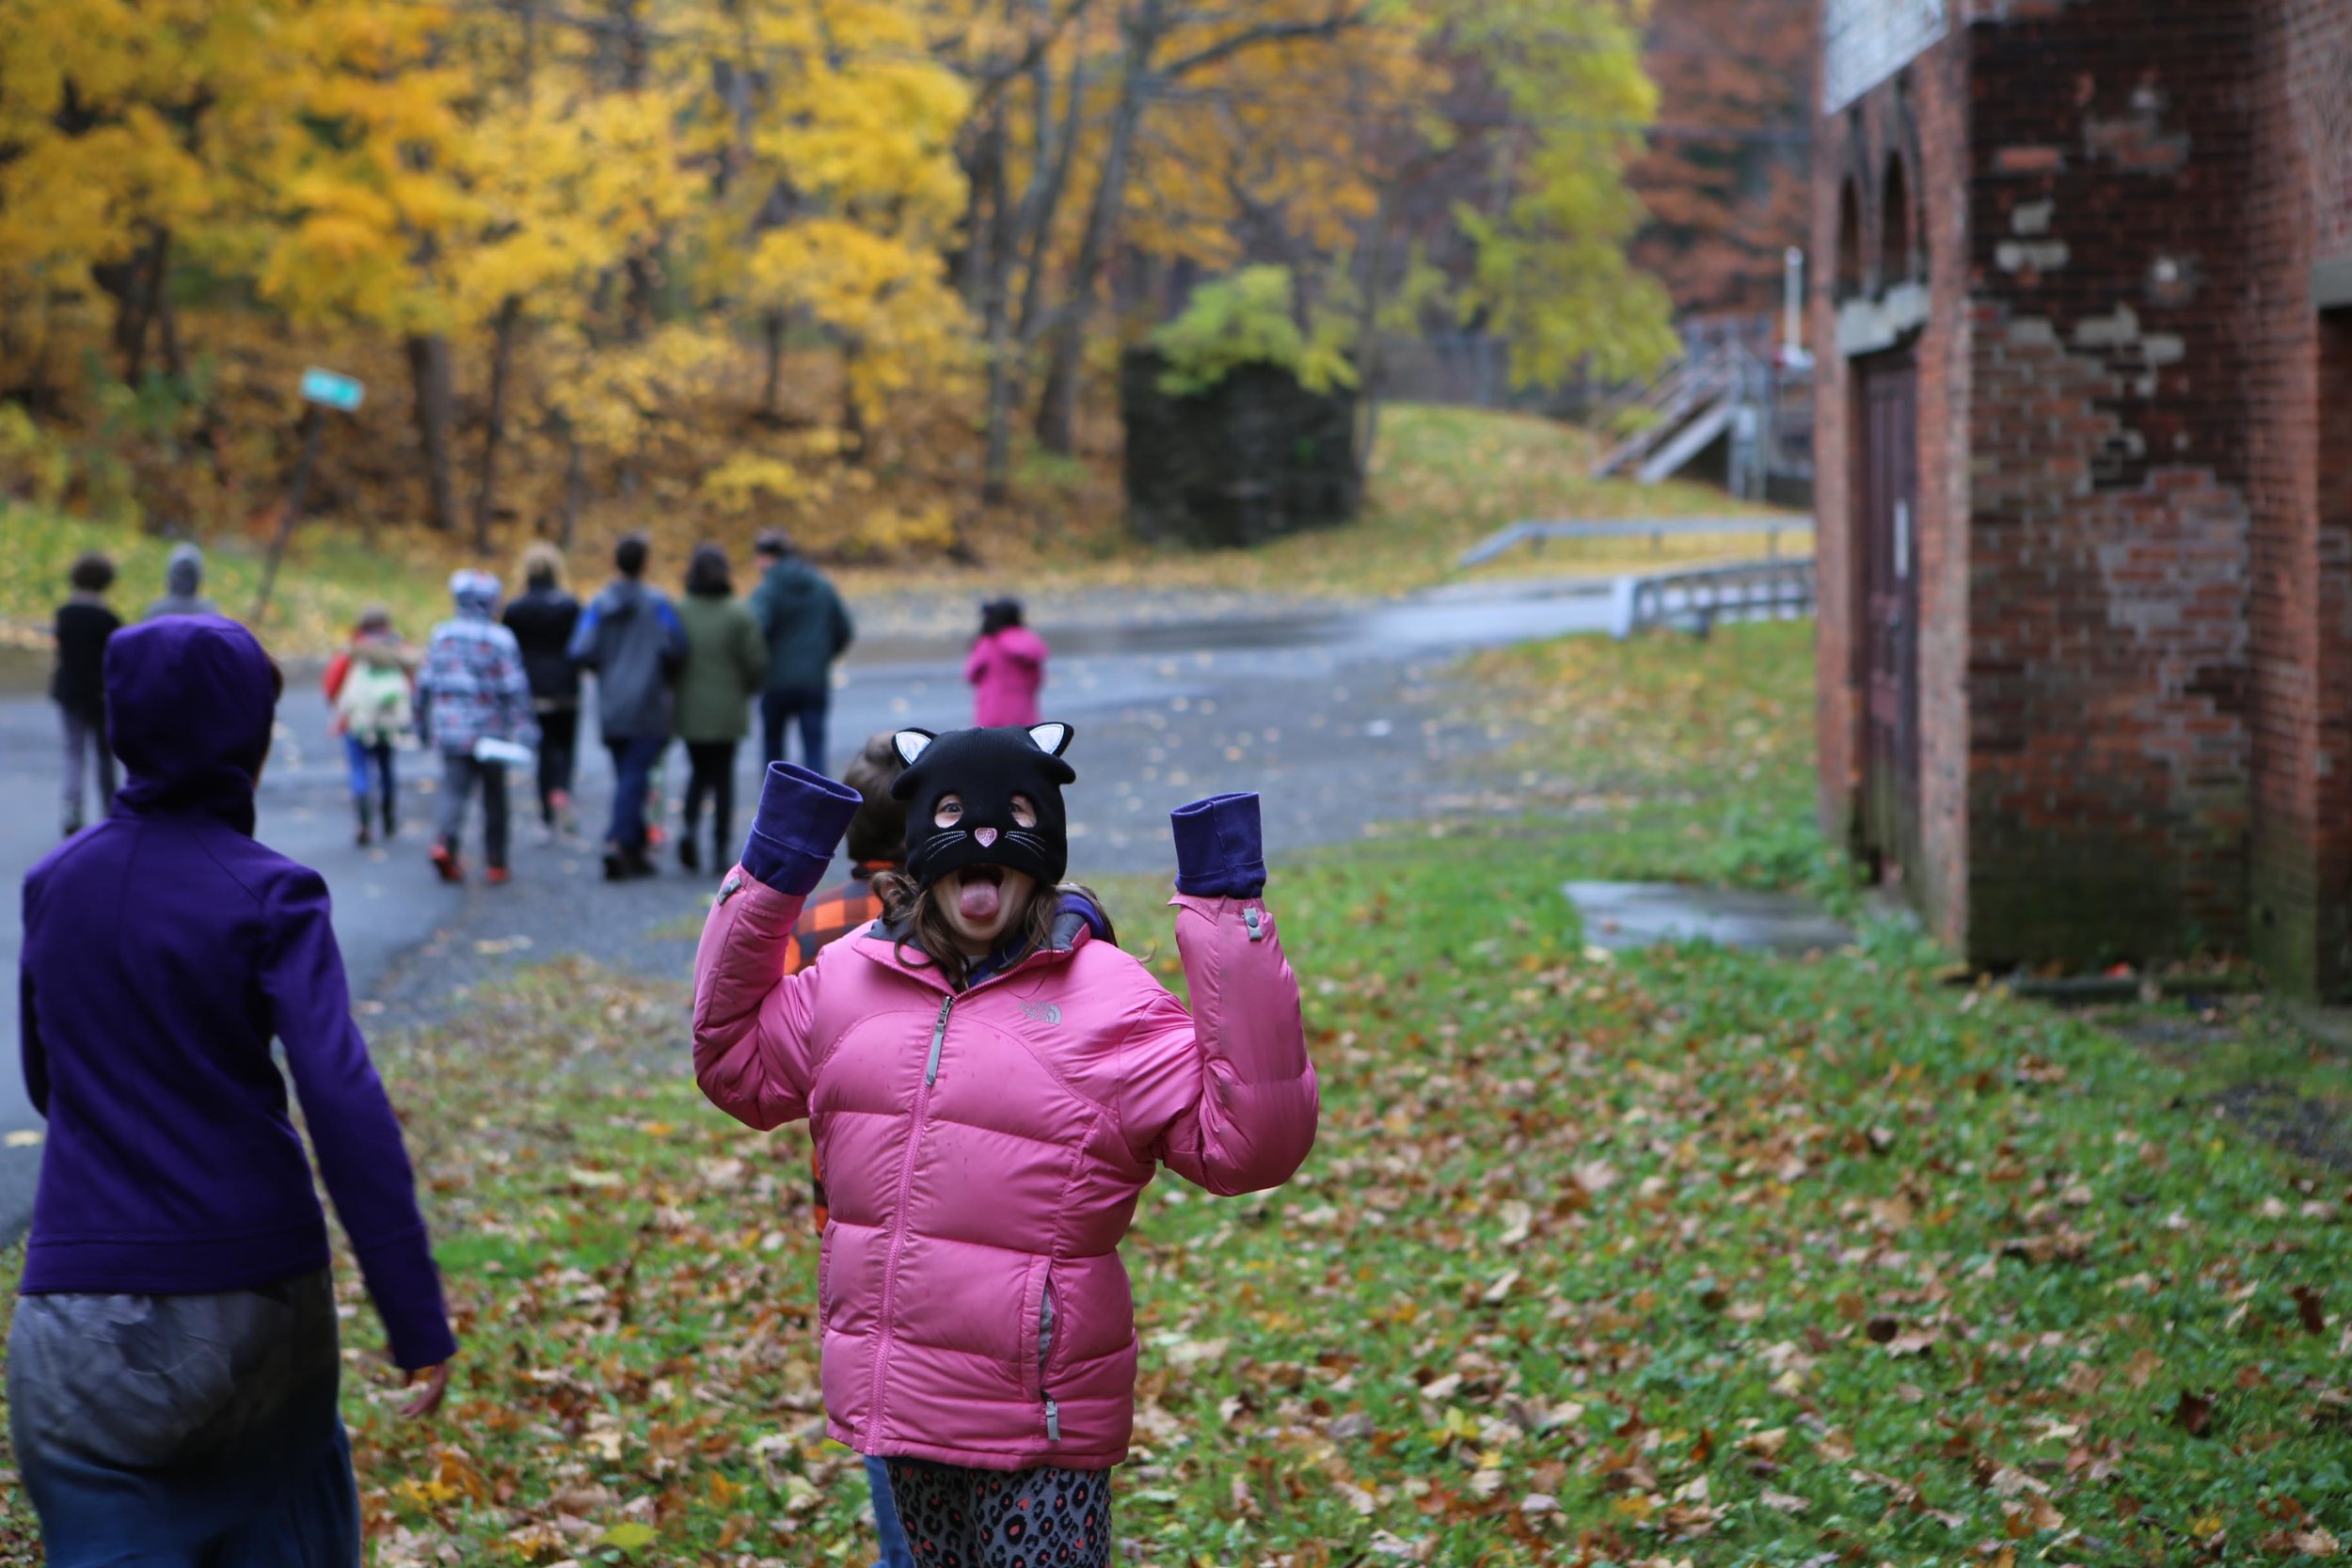
Examining the 2018 UN Special Report on Climate Change, we asked: How did we get to now? Together we dove into studies of population, looking at videos and images to understand the history of urbanization and population growth. We watched a real-time online population counter, and then used metronomes, poker chips, and pieces of paper to make sense of the statistics we were learning. We played a clapping and card game to demonstrate the concept of a “positive feedback loop” in population, and we conducted research and created mind-maps to make connections between population, consumption, and ecology. Together we broke down the basics of the greenhouse effect and global warming, and played a series of games to understand the difference between renewable and non-renewable resources; cooperative (and non-cooperative) strategies to sustain resources within a system; and the idea of balance within ecosystems. We also learned stories and histories of communities that sustainably managed their ecosystems to keep balance -- and headed off on our own hike in the Greenport Conservation Area to see how people are currently managing ecosystems, creating homes for native pollinators and encouraging certain habitats.
We also studied the industrial revolution and its impacts on the global economy and on labor -- engaging in an assembly line activity to learn about factory environments, work conditions, and the labor movement. We considered the connection between this history and contemporary sweatshops, and headed out of the classroom to look at old factory buildings and worker houses in the area.


See photos from our Fall 2018 After School Classes, here!
See photos from our Fall 2018 Expo, here!
